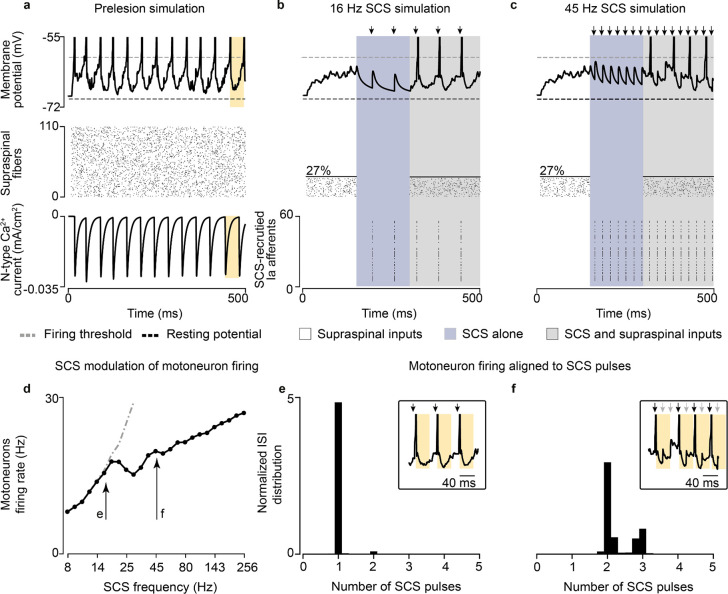
Fig. 2 |. Supraspinal input facilitates SCS.
a, Simulation of the membrane potential of a single motoneuron driven by supraspinal fibers prior to the lesion (top), raster plot of each supraspinal fiber firing stochastically (middle), ionic current of N-type Ca2+ of the motoneuron (bottom). Motoneuron firing rate is limited by the slow calcium dynamics (yellow). b, Simulation of the membrane potential of a single motoneuron after the lesion (white background), during SCS alone (16 Hz, 50% amplitude; blue) and concurrent residual supraspinal inputs and SCS (gray, top), raster plot of each residual supraspinal fiber firing stochastically after the lesion (middle), raster plot of each Ia afferent firing synchronously after each SCS pulse (bottom). c, Same as b at a higher SCS frequency (45 Hz, 50% amplitude). d, Mean motoneuron pool firing rate as a function of SCS frequencies, coupled up to 19 Hz (i.e., motoneuron firing rate equals stimulation frequency up to 19 Hz SCS represented by the dashed gray line) and effectively decoupled at higher stimulation frequencies while still increasing motoneuron firing. e, Probability distribution of the motoneuron pool ISI normalized by the stimulation interpulse interval (16 Hz SCS), indicating the number of SCS pulses between action potentials (in this case, 1 SCS pulse). Inset indicates the membrane potential of a motoneuron during concurrent supraspinal inputs and SCS, highlighting in yellow the time constraint of the slow calcium dynamics. f, Same as e at a higher SCS frequency (45 Hz). Arrows indicate stimulation pulses. Light arrows indicate skipped pulses elicited within the slow calcium dynamics in inset in f.

