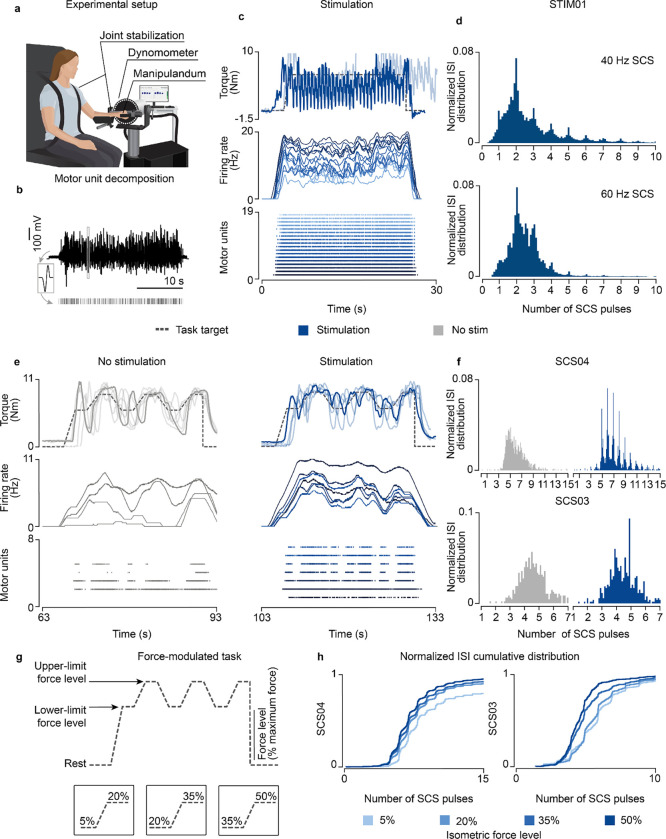
Fig. 6 |. Experimental validation in humans with paralysis.
a, Schematic of the experimental setup in participants with upper-limb paralysis performing a force task with their paretic arm (same setup was adapted for the participant with lower-limb paralysis). b, Schematic of motor unit decomposition using surface or high-density EMG performing a voluntary movement along with a sample raster plot for a detected motor unit waveform. c, Example of torque traces (top, overlapped with a trace from another repetition), firing rate (middle) and raster plot of the motor units (bottom) of both extensor muscles (Vastus Lateralis, Rectus Distal, sorted by average firing rate) during the isometric force task (35% of maximum force) in STIM01 during 40 Hz SCS. d, Histogram of ISI normalized probability distribution of the extracted motor units in STIM01 during 40 Hz SCS (above, 2 repetitions) and 60 Hz SCS (below, 2 repetitions). e, Example of torque traces (top, overlapped with trace from all repetitions), firing rate (middle) and raster plot of the motor units (bottom) during the force-modulated task (35–50% of the maximum force) in SCS04 with (60 Hz SCS) and without stimulation. f, Histograms of ISI normalized probability distribution of the extracted motor units in SCS04 (top, 18 repetitions) and SCS03 (bottom, 4 repetitions) with and without stimulation during 50% force-level period. g, Schematic of the parametrized isometric force-modulated task between pairs of force levels (force level is represented as percent of maximum force). Its lower and upper-limits were modified to perform a 5–20% maximum force task, 20–35% and 35–50%. h, Normalized ISI cumulative distribution of the extracted motor units during SCS in SCS04 (left) and SCS03 (right) during SCS for all force levels for all trials (18 repetitions for SCS04 for all for levels, 9 repetitions in SCS03 for 5% isometric force level, 7 for 20%, 7 for 35% and 4 for 50%).

