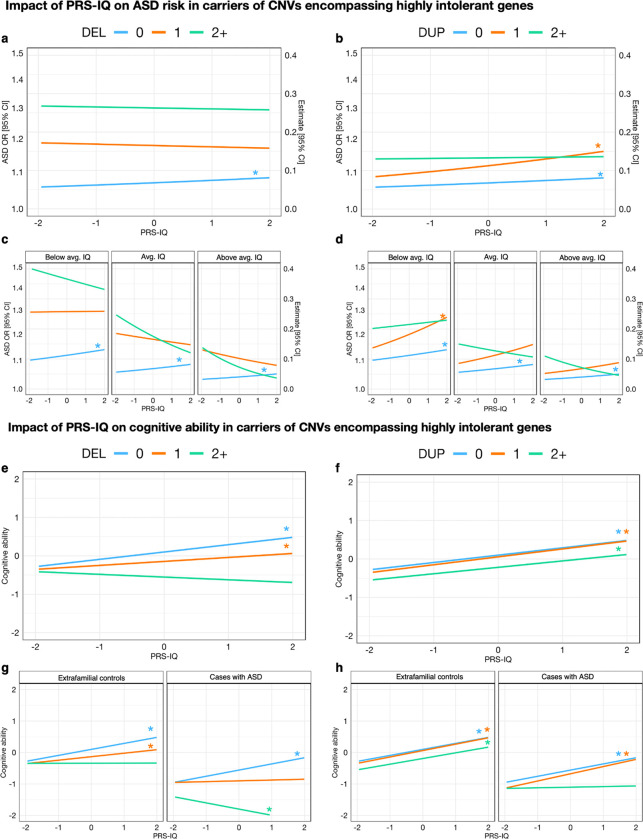
Figure 3. Deletions and duplications in highly intolerant genes modulate the impact of PRS-IQ on ASD risk and cognitive ability.
Deconstructing the significant negative interaction between CNV burden and PRS-IQ that was identified in Figure 1. These interaction plots highlight the impact of highly intolerant CNVs in attenuating the effect of PRS-IQ on ASD risk and cognitive ability. a,b) Interaction plot showing the effect of PRS-IQ on ASD risk as moderated by the number of highly intolerant CNVs carried by each individual. PRS-IQ has a positive linear impact on ASD risk in individuals who do not carry any highly-intolerant deletions (ncases=8,170; ncontrols=168,499) or duplications (ncases=8,028; ncontrols=166,003). Carrying 1 deletion reduces the impact of PRS-IQ on ASD (ncases=162; ncontrols=1,049), and the negative effect of PRS-IQ on ASD risk is exacerbated in carriers of ≥2 deletions (ncases=94; ncontrols=256). Carrying highly intolerant duplications attenuates, but to a lesser extent compared to deletions, the effect of PRS-IQ on ASD risk (ncases=227; ncontrols=2512 carrying one duplication, and ncases=171; ncontrols=1,289 carrying ≥2 duplications). c, d) Adding cognitive ability as the second moderator reveals that these trends remain consistent, regardless of the scaled cognitive ability (1 standard deviation below the mean (−0.97), mean (0.067), or 1 standard deviation above the mean (1.10)) of the samples. e, f) Interaction plot showing the effect of PRS-IQ on cognitive ability as moderated by the number of highly intolerant CNVs carried by each subject. Except for individuals that carry ≥2 highly intolerant deletions, PRS-IQ has a positive linear impact on cognitive ability. However, carrying highly-intolerant deletions attenuated the impact of PRS-IQ on cognitive ability. The attenuation of PRS-IQ in the presence of highly intolerant deletions (g) and duplications (h) was more pronounced in cases with ASD compared to extrafamilial controls. Asterisks (*) denote statistically significant estimates of PRS-IQ, interacting with its moderator variable(s) (P value ≤ 0.05 following FDR adjustment for multiple corrections). While not all regression lines are statistically significant, these interaction plots should be interpreted as descriptive trends between the genetic risk factors and outcomes. See Table ST4 and Table ST5 for a detailed number of carriers and regression model results.

