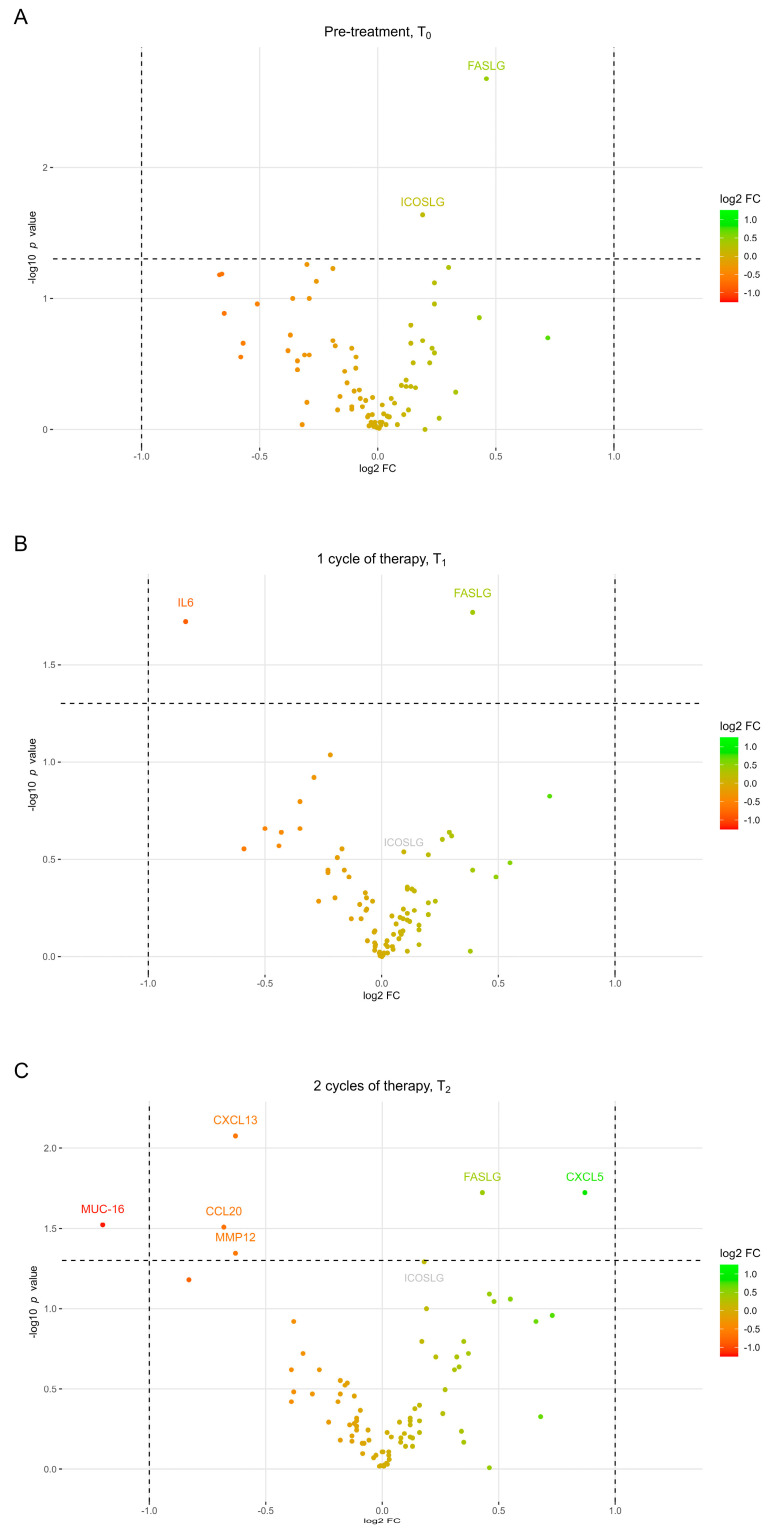
Figure 1.
Volcano plots showing log2 fold change in plasma protein expression between patients with above-median PFS and patients with below-median PFS at three different time points. Proteins with a positive log2 FC (the right part of the volcano plot) are upregulated in patients with above-median PFS, while proteins with a negative log2 FC (the left part of the volcano plot) are upregulated in patients with below-median PFS. (A) Differences in protein expression before treatment initiation, (B) after one and (C) two cycles of treatment. Vertical dashed lines represent 2-fold change, while the horizontal dashed line represent a p-value of 0.05. Proteins with expressions below the limit of detection were excluded from the analysis. FC, fold change; PFS, progression-free survival; T0, pre-treatment; T1, after one cycle of therapy; T2, after two cycles of therapy.

