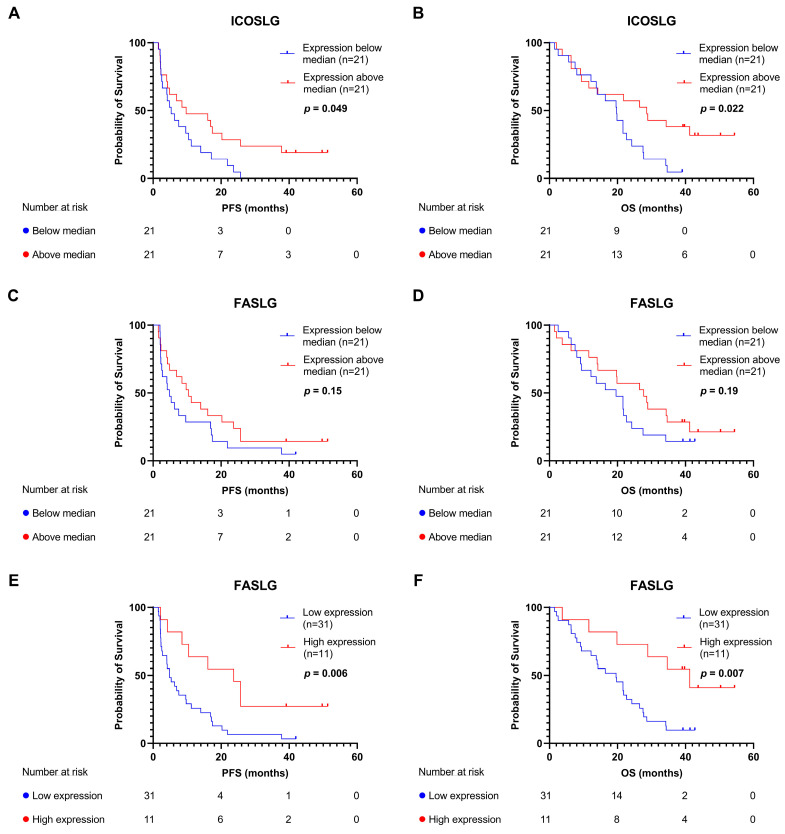
Figure 2.
Kaplan–Meier survival analyses for PFS and OS. (A) PFS according to median expression of ICOSLG. (B) OS according to median expression of ICOSLG. (C) PFS according to median expression of FASLG. (D) OS according to median expression of FASLG. (E) PFS according to high expression of FASLG (expression in the upper quartile). (F) OS according to high expression of FASLG. FASLG, Fas ligand; ICOSLG, inducible T-cell co-stimulator ligand; OS, overall survival; PFS, progression-free survival.

