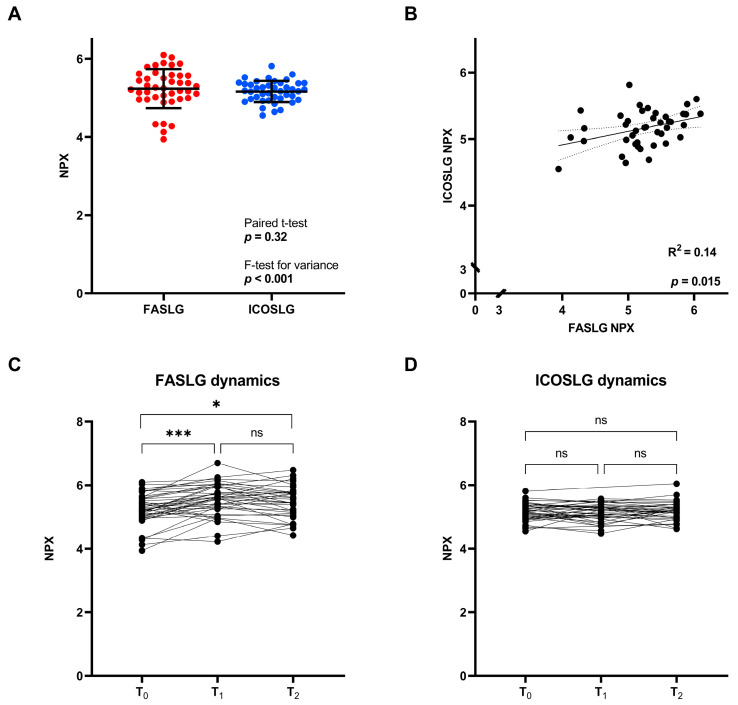
Figure 3.
Expressions of FASLG and ICOSLG. (A) NPX values at T0. (B) Correlation between FASLG and ICOSLG NPX values at T0. The dotted lines represent the 95% confidence interval. (C) Dynamics in FASLG expression during the initial weeks of treatment. (D) Dynamics in ICOSLG expression during the initial weeks of treatment. FASLG, Fas ligand; ICOSLG, inducible T-cell co-stimulator ligand; NPX, normalized protein expression; T0, pre-treatment; T1, after one cycle of therapy; T2, after two cycles of therapy; ns, not significant; *, p < 0.05; ***, p < 0.001.

