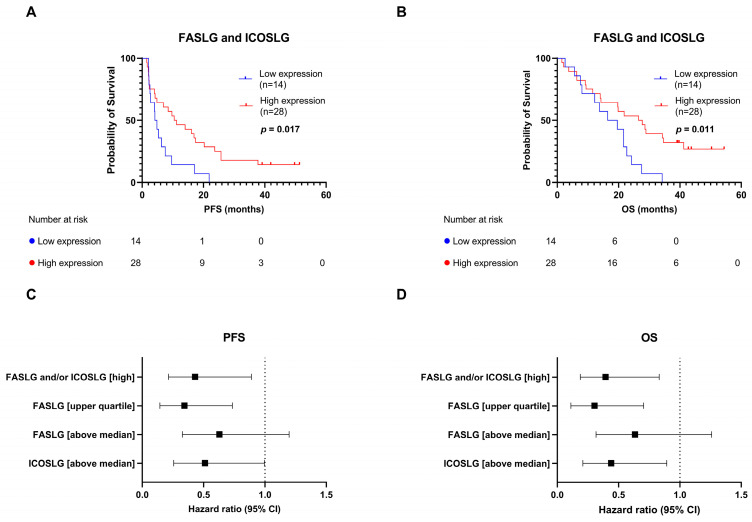
Figure 4.
Combining expressions of FASLG and ICOSLG before treatment initiation. (A) PFS according to FASLG and ICOSLG expressions. Patients were stratified into the high-expression subgroup if they had an above-median expression of either FASLG and/or ICOSLG. Patients with low expressions of both proteins were stratified into the low-expression subgroup. (B) OS according to FASLG and ICOSLG expressions. (C) Forest plot showing HR and 95% CI for single and combined protein-expression subgroups for PFS. (D) Forest plot showing HR and 95% CI for single and combined protein-expression subgroups for OS. CI, confidence interval; FASLG, Fas ligand; ICOSLG, inducible T-cell co-stimulator ligand; OS, overall survival; PFS, progression-free survival.

