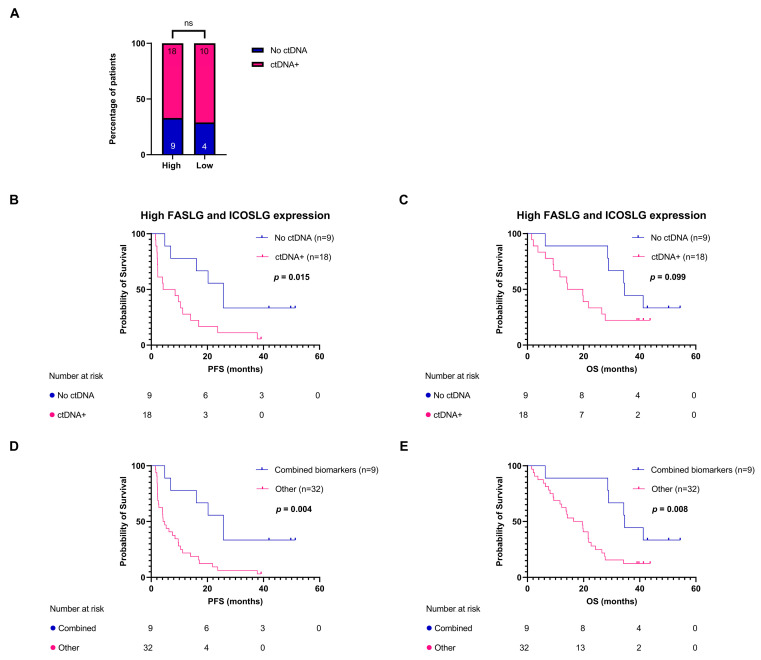
Figure 5.
Combining circulating biomarkers. (A) Proportion of patients in each FASLG and ICOSLG expression subgroup having a presence or absence of ctDNA mutations after treatment initiation. (B) PFS according to presence or absence of ctDNA mutations after treatment initiation in the high-expression FASLG and ICOSLG subgroups. (C) OS according to the presence or absence of ctDNA mutations after treatment initiation in the high FASLG and ICOSLG expression subgroup. (D) PFS according to a combined biomarker profile, i.e., patients in the high-expression FASLG and ICOSLG subgroups with an absence of ctDNA mutations, compared to the rest of the patients. (E) OS according to a combined biomarker profile. FASLG, Fas ligand; ICOSLG, inducible T-cell co-stimulator ligand; ns, not significant; OS, overall survival; PFS, progression-free survival.

