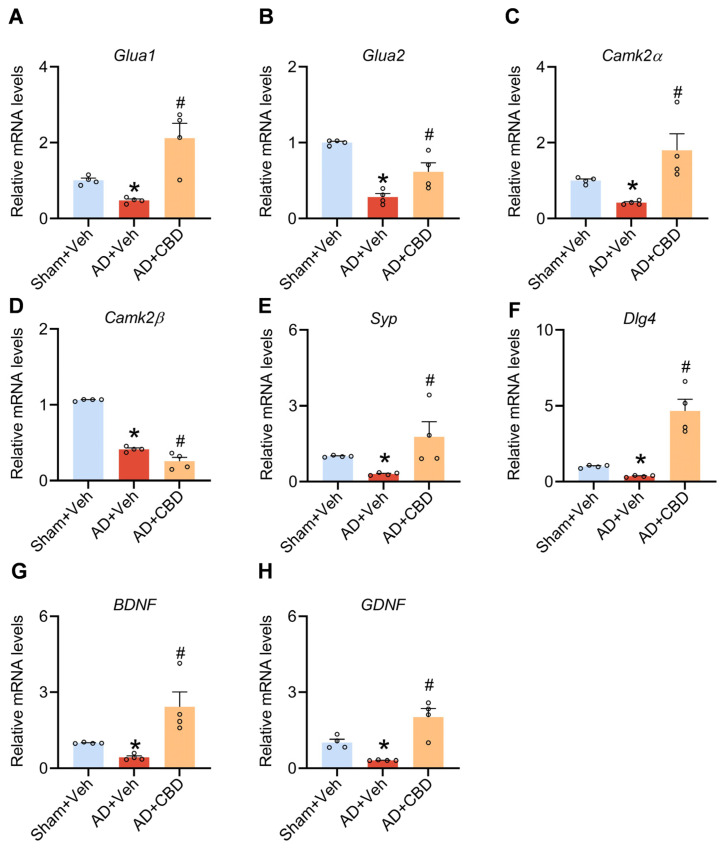
Figure 3.
CBD’s neuroprotective role and synaptic dysfunction alleviation in Aβ1–42-induced mice. (A) Quantified image showing the mRNA expression level of Glua1. (B) Quantified image showing the mRNA expression level of Glua2. (C) Quantified image showing the mRNA expression level of CamKIIα. (D) Quantified image showing the mRNA expression level of CamKIIβ. (E) Quantified image showing the mRNA expression level of Syp. (F) Quantified image showing the mRNA expression level of Dlg4. (G) Quantified image showing the mRNA expression level of BDNF. (H) Quantified image showing the mRNA expression level of GDNF. Data are shown as mean ± SEM (n = 4). * p < 0.05 vs. sham + Veh group; # p < 0.05 vs. AD + Veh group.

