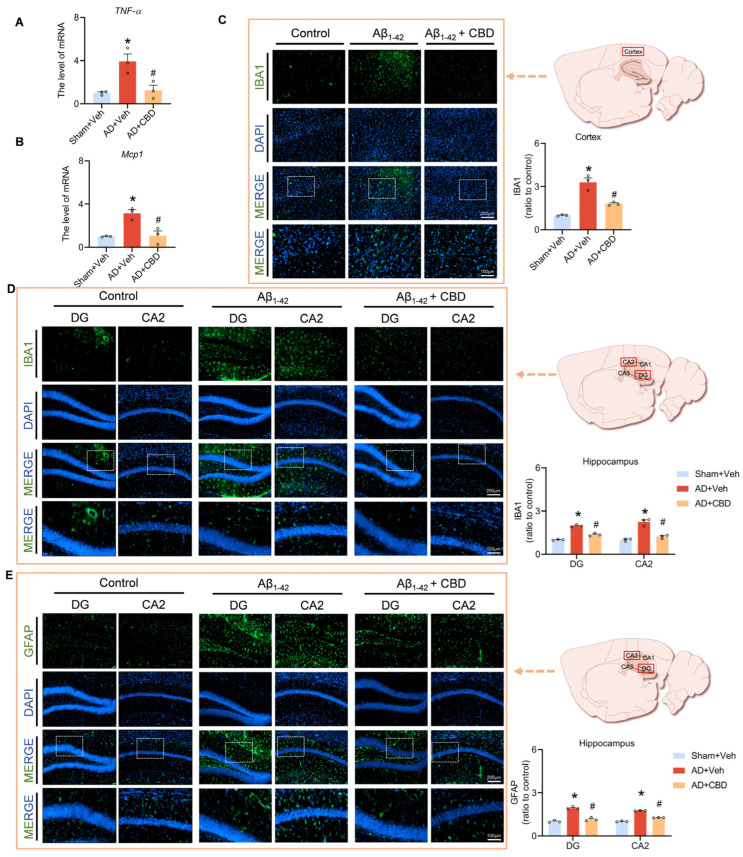
Figure 4.
CBD’s modulation of inflammatory responses in Aβ1–42-induced mice. (A) Quantified image showing the mRNA expression level of TNF-α. (B) Quantified image showing the mRNA expression level of MCP1. (C) Representative fluorescence micrographs showing IBA1 expression in the cortex (scale bar: 200 μm) and quantification of the total number of IBA1+ cells in the cortex. (D) Representative fluorescence micrographs showing IBA1 expression in the DG and CA2 regions of the hippocampus (scale bar: 200 μm) and quantification of the total number of IBA1+ cells. (E) Representative fluorescence micrographs showing GFAP expression in the DG and CA2 regions of the hippocampus (scale bar: 200 μm) and quantification of the total number of GFAP+ cells. Data are shown as mean ± SEM (n = 3). * p < 0.05 vs. sham + Veh group; # p < 0.05 vs. AD + Veh group.

