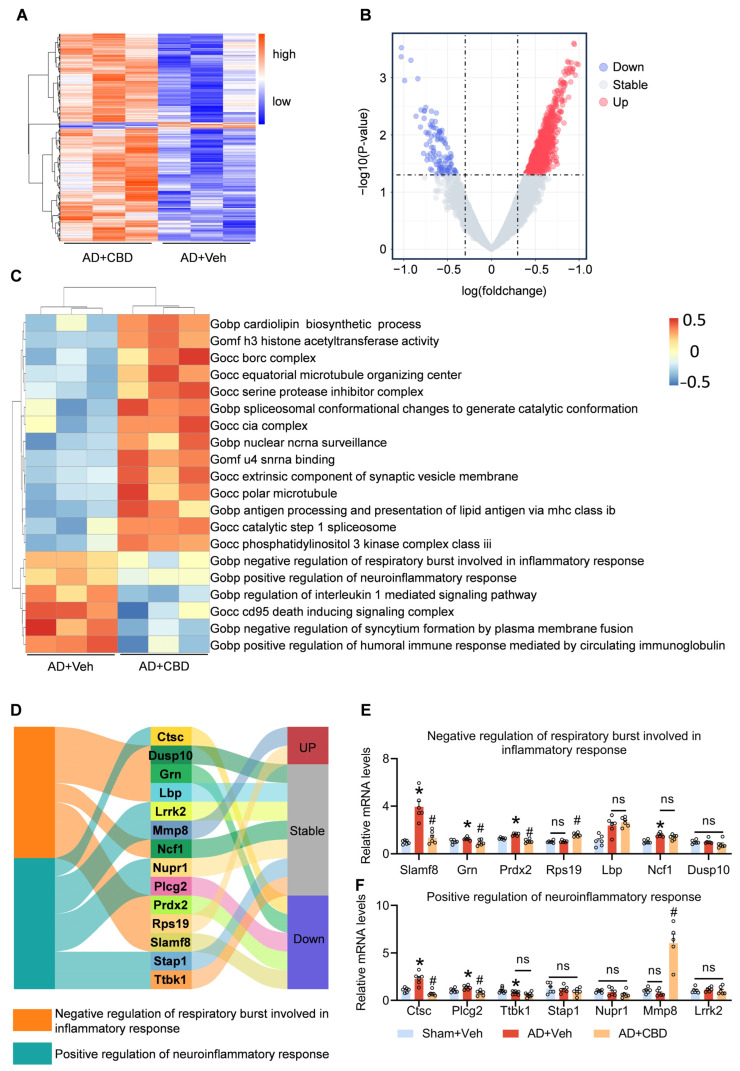
Figure 5.
Revealing the underlying mechanisms of CBD’s anti-inflammatory effects. (A) Heatmap of DGEs in CBD-treated Aβ1–42-induced mice and Aβ1–42-induced mice. (B) Volcano plot of differentially expressed GO pathways in CBD-treated Aβ1–42-induced mice compared to Aβ1–42-induced mice. (C) Heatmap of the result of GSVA in CBD-treated Aβ1–42-induced mice and Aβ1–42-induced mice. (D) Sankey image showing the result of the gene expression related to the inflammation pathways. (E) Quantified image showing the mRNA expression levels of genes in the negative regulation of respiratory bursts involved in the inflammatory response pathway. (F) Quantified image showing the mRNA expression level of genes in the positive regulation of the neuroinflammatory response pathway. Data are shown as mean ± SEM (n = 3). * p < 0.05 vs. sham+Veh group; # p < 0.05 vs. AD+Veh group, ns: not significant.

