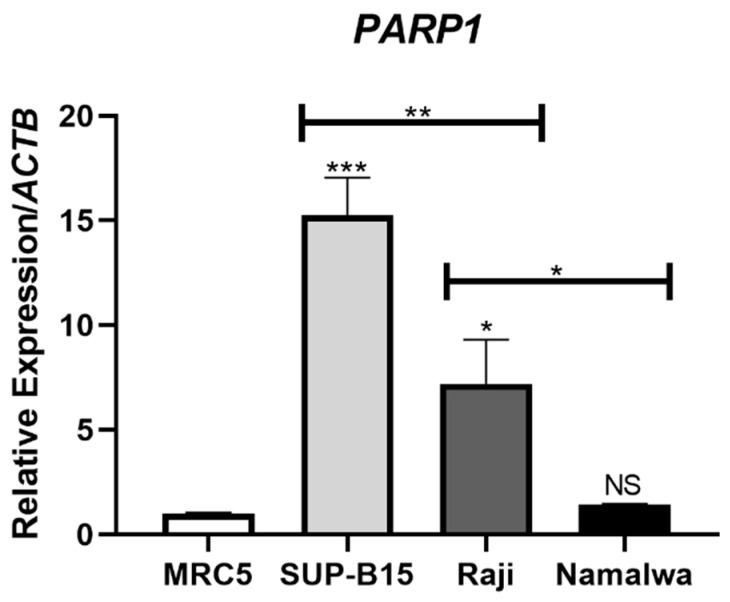
Figure 1.
Overexpression of PARP1 in the SUP-B15 cell line compared with other lymphoblastic cell models. PARP1 expression was normalized through the endogenous control ACTB and the non-neoplastic cell line MRC5 was used as the calibrator. Statistical differences were analyzed through ANOVA followed by Bonferroni’s multiple comparisons. NS: Not significant; * p < 0.05; ** p < 0.01, *** p < 0.0001.

