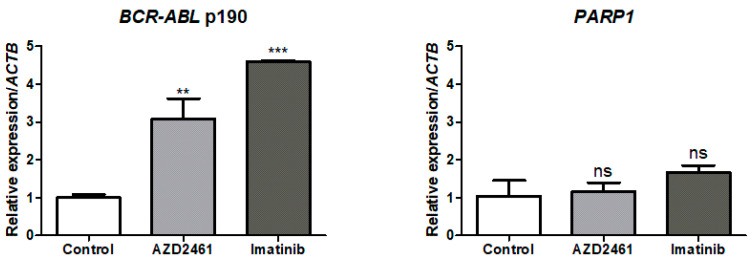
Figure 4.
Expression levels of the biomarker BCR::ABL1 p190 and the PARP1 transcript in the SUP-B15 cell line after treatment with AZD2461 or imatinib. Cells were treated with sub-inhibitory concentrations of 1.5 µM of either AZD2461 or imatinib in a 24-h incubation period and the graphs represent the means from three distinct experiments. BCR::ABL1 p190 and PARP1 expression were normalized through the endogenous control ACTB. Expression levels were measured in the SUP-B15 cell line comparing the non-treated control experiment and the experiments after the proposed treatments. Statistical differences were analyzed through ANOVA followed by Bonferroni’s multiple comparisons. ns: Not significant; ** p < 0.01, *** p < 0.0001.

