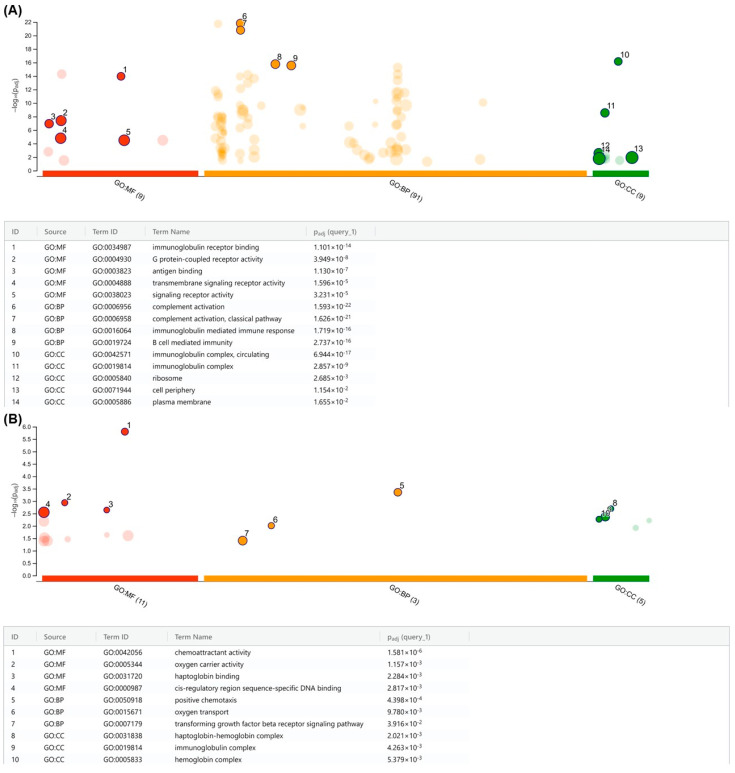
Figure 7.
Functional gene ontology (GO) annotation of CNAs from the SUP-B15 cell line. Key significant terms enriched in gene (A) gains and (B) losses are annotated in the table below. The x-axis displays the functional terms and the y-axis shows −log10 of the FDR-adjusted p-value from the enrichment test. (GO: MF) molecular function, (GO: BP) biological process, (GO: CC) cellular component. GO size represents the number of total genes in each specific ontology.

