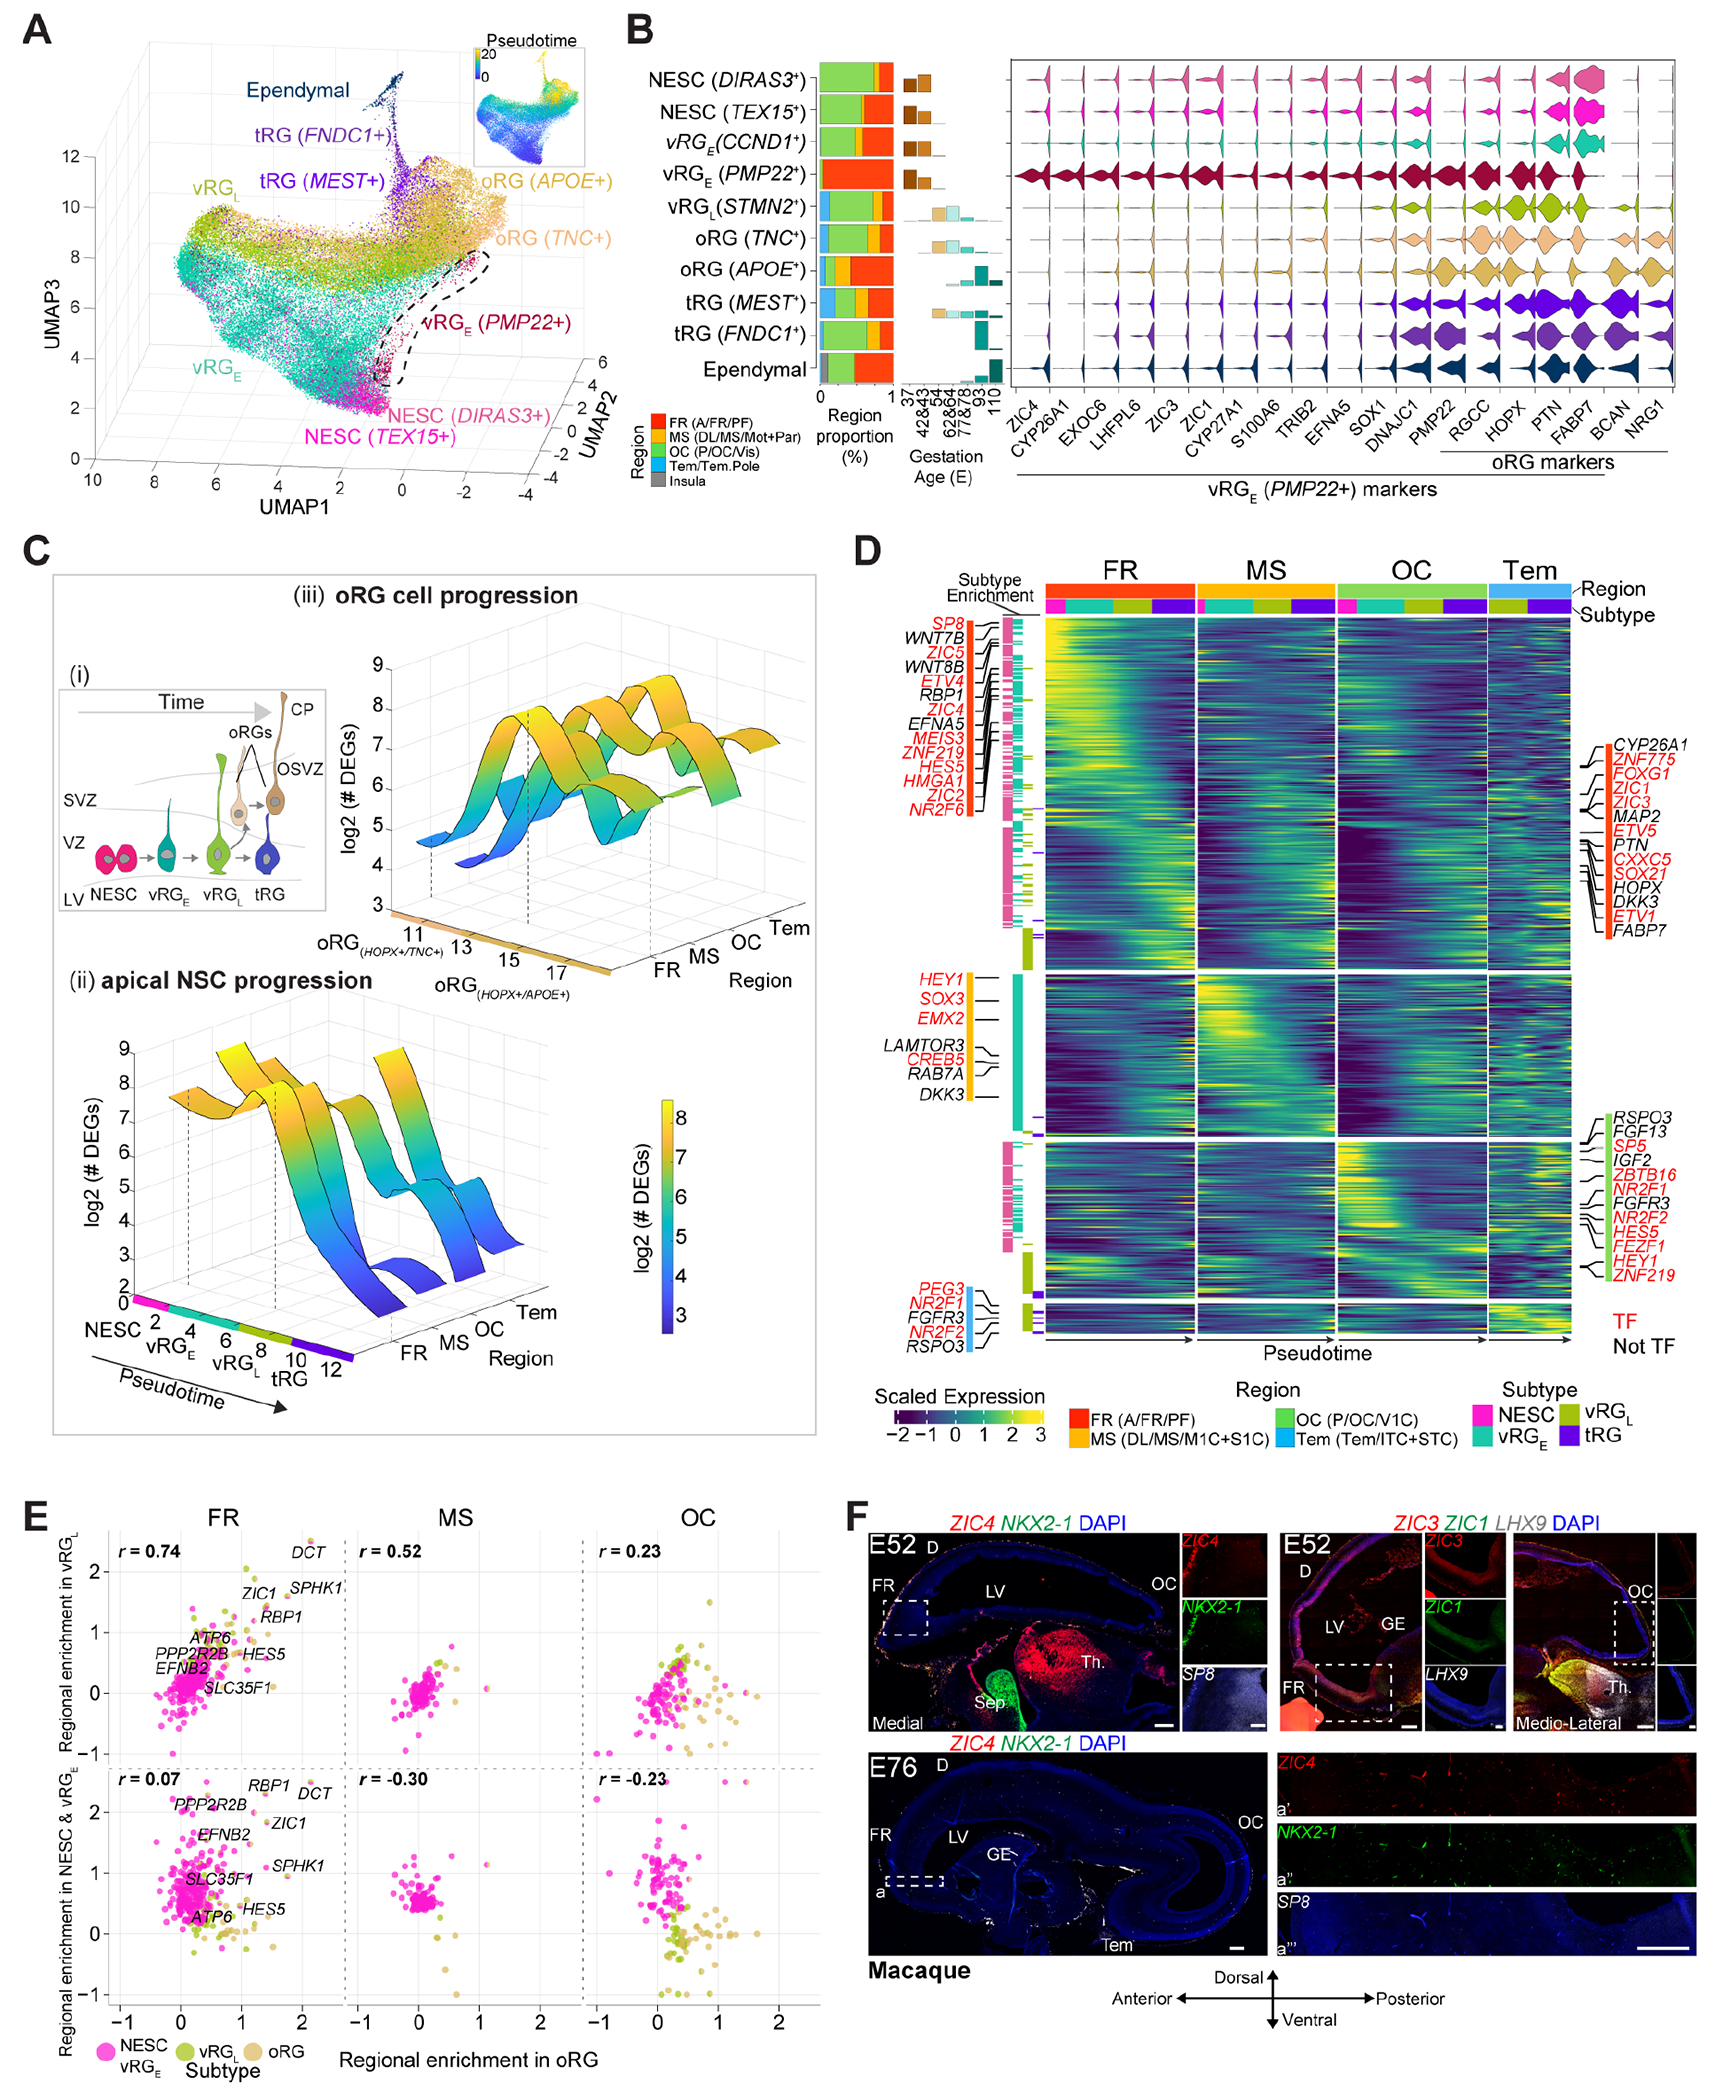
Fig. 4. Transcriptomic variation of NSC progression across cortical regions.

(A) Cortical NSC subtypes and pseudotime. (B) Region and age proportion of the NSCs (left). Markers for the anterior-enriched PMP22+ RG subtype (right). (C) Scheme of NSCs progression. OSVZ: outer SVZ; CP: cortical plate (i). Number of regional DEGs along ventricular NSCs (ii) and oRG (iii) progression. (D) Region-specific gene cascades along the ventricular NSC progression. (E) Region specificity correlation between early (NESCs and vRGE) or late (vRGL) NSCs versus oRG. Colors denote the subtypes showing region enrichment. (F) RNAscope of macaque brain sections. Scale bar: 500 μm (panoramic) and 200 μm (zoom-in). Sep: septum; Th: thalamus.
