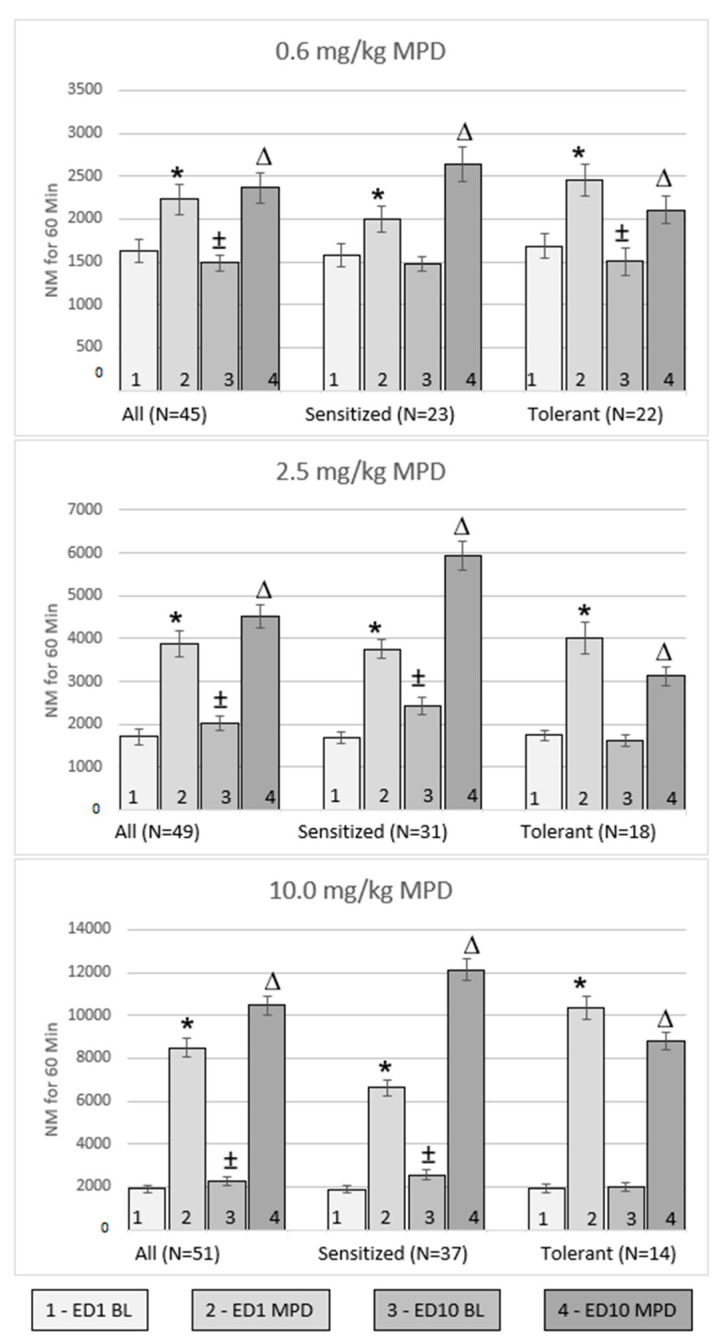
Figure 2.
Summary of the number of movements (NM) in relation to initial saline injections (ED1 BL) (number 1), acute MPD (ED1 MPD) (number 2), ED10 BL activity after saline injections (number 3), and the activity following chronic MPD exposure (ED10 MPD) (number 4) at each respective MPD dose. For each dose, the left histogram represents the total activity of all animals, the middle histogram represents the activity of animals that expressed sensitization, and the right histogram represents the activity of animals that expressed behavioral tolerance. N = no. of animals in each group; ED1 BL = activity following initial saline injection on ED1; ED1 MPD = activity following acute MPD exposure on ED1; ED10 BL = activity following saline injection on ED10 after MPD administration during ED2–6; ED10 MPD = activity following chronic MPD exposure on ED10. * Represents a significant (p < 0.05) difference when comparing ED1 MPD to ED1 BL; ± represents significant (p < 0.05) differences comparing ED10 BL/ED1 BL; Δ represents a significant (p < 0.05) difference comparing ED10 MPD/ED1 MPD. The figure shows the acute effect of MPD, the effect of repetitive (chronic) MPD on ED10 baseline (BL) activity after chronic MPD exposure, and 3 washout days, as well the effect of chronic MPD on ED10.

