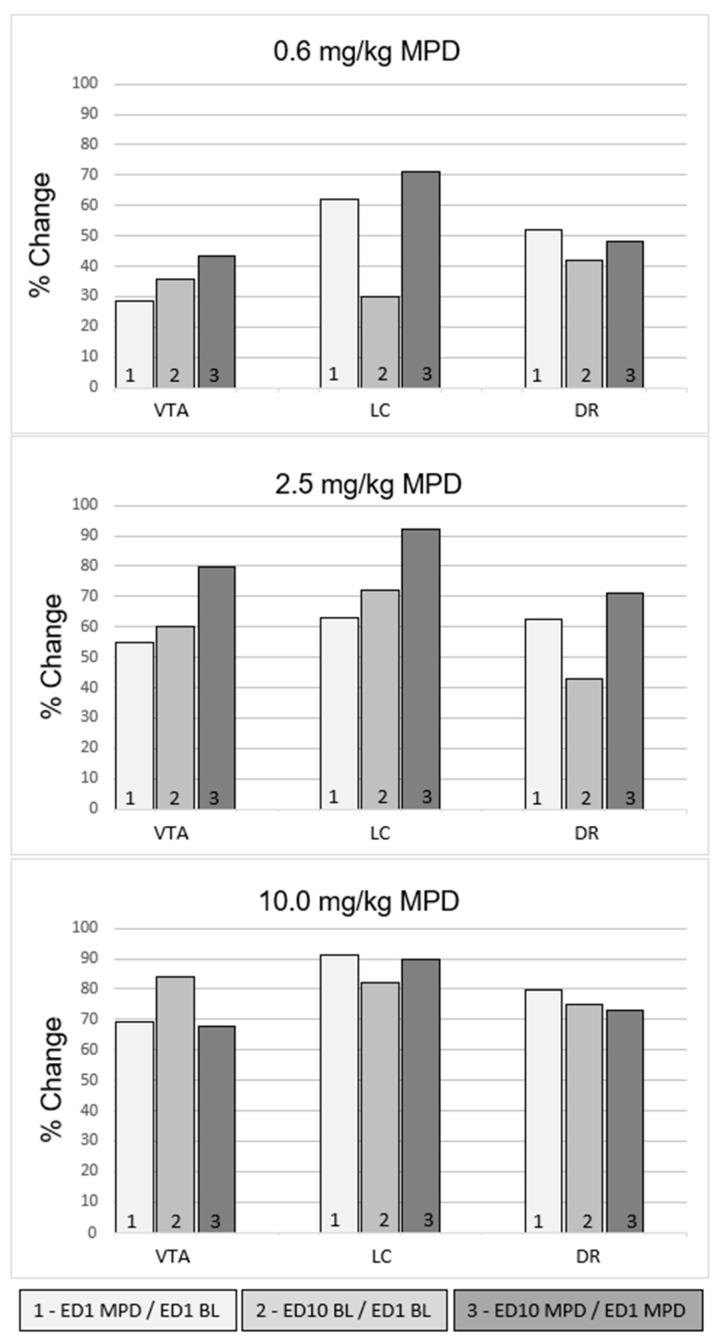
Figure 3.
Summary of the statistically (p < 0.05) calculated neuronal responses percentages (%) of VTA, LC, and DR neurons of the all animals group. The figure demonstrates (in %) how many VTA, LC, and DR neurons responded to MPD. Each brain structure has a significantly (p < 0.05) different response, which was calculated using the Chi-squared test.

