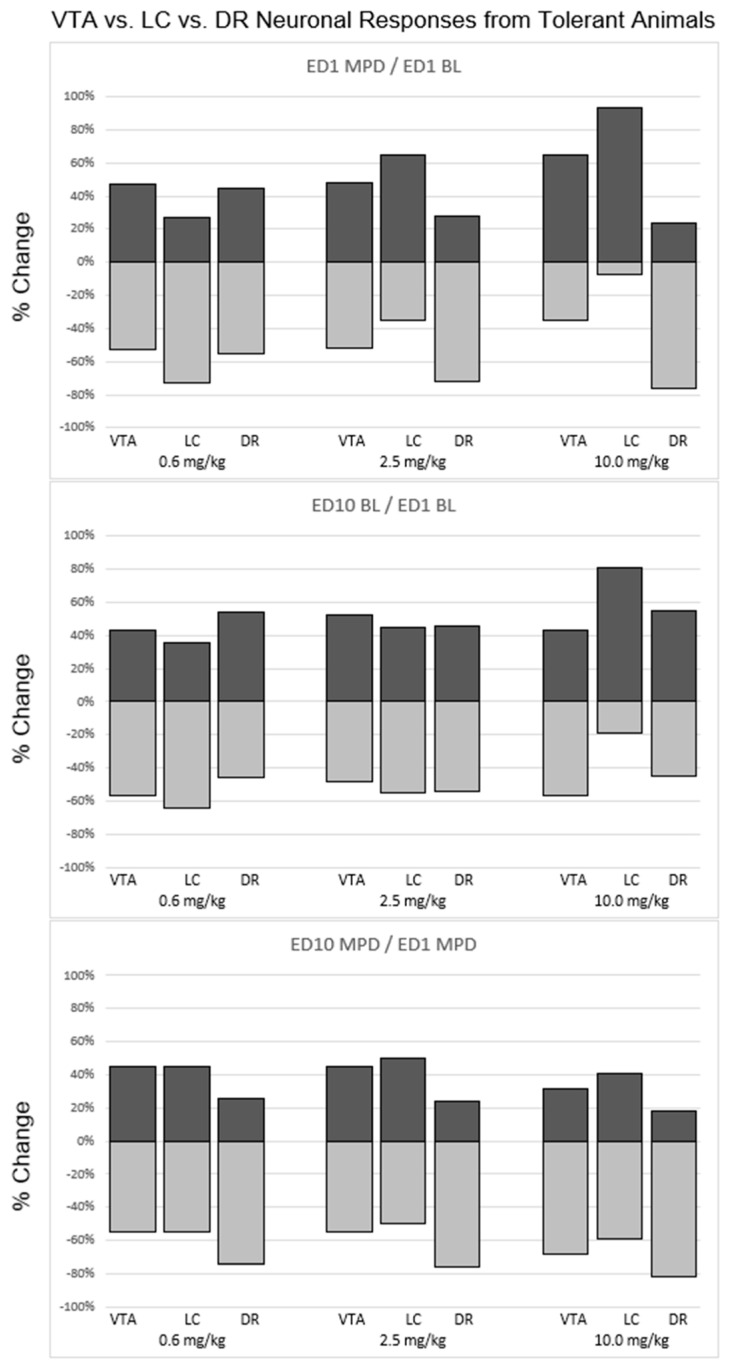
Figure 5.
Summary of the statistically calculated direction (excitation/attenuation) neuronal responses of VTA, LC, and DR neurons recorded from animals that exhibited behavioral tolerance after chronic MPD exposure. Each bar represents a percentage of the neuronal responses within each brain region that responded to each respective MPD dose. A positive percentage represents the proportion of neurons within a brain region that exhibited a significant (p < 0.05) increase in neuronal activity. A negative percentage represents the proportion of neurons within a brain region that exhibited a significant (p < 0.05) decrease in neuronal activity. Top panel: comparison of VTA, LC, and DR responses after acute MPD exposure (ED1 MPD/ED1 BL). Middle panel: comparison of VTA, LC, and DR responses at baseline (ED10 BL/ED1 BL). Bottom panel: comparison of VTA, LC, and DR responses after chronic MPD exposure (ED10 MPD/ED1 MPD).

