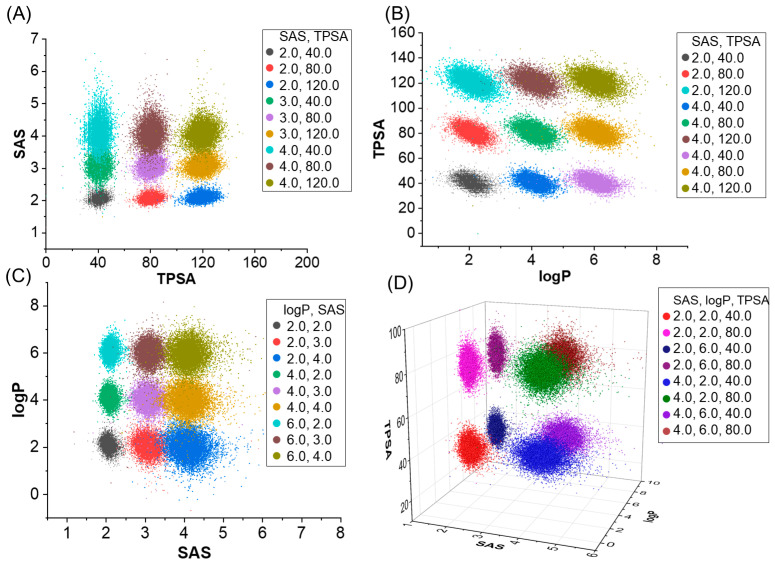
Figure 3.
Distribution of molecular properties generated when specifying multiple properties using a model trained on the GuacaMol dataset. SAS and TPSA (A), logP and TPSA (B), SAS and logP (C), SAS, logP and TPSA (D). The legend in the upper right-hand corner represents the combinations of molecular properties that we defined.

