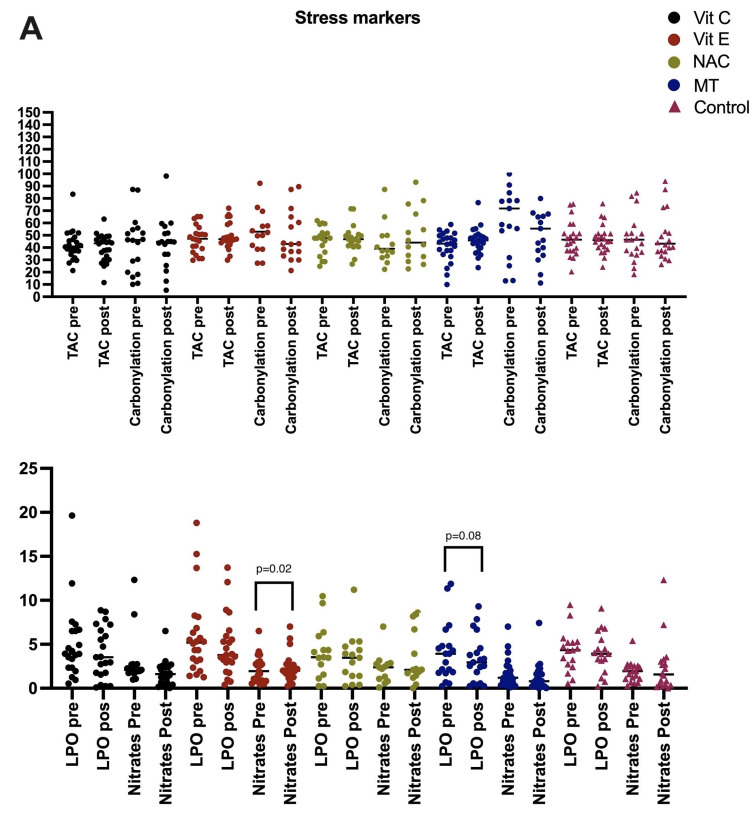
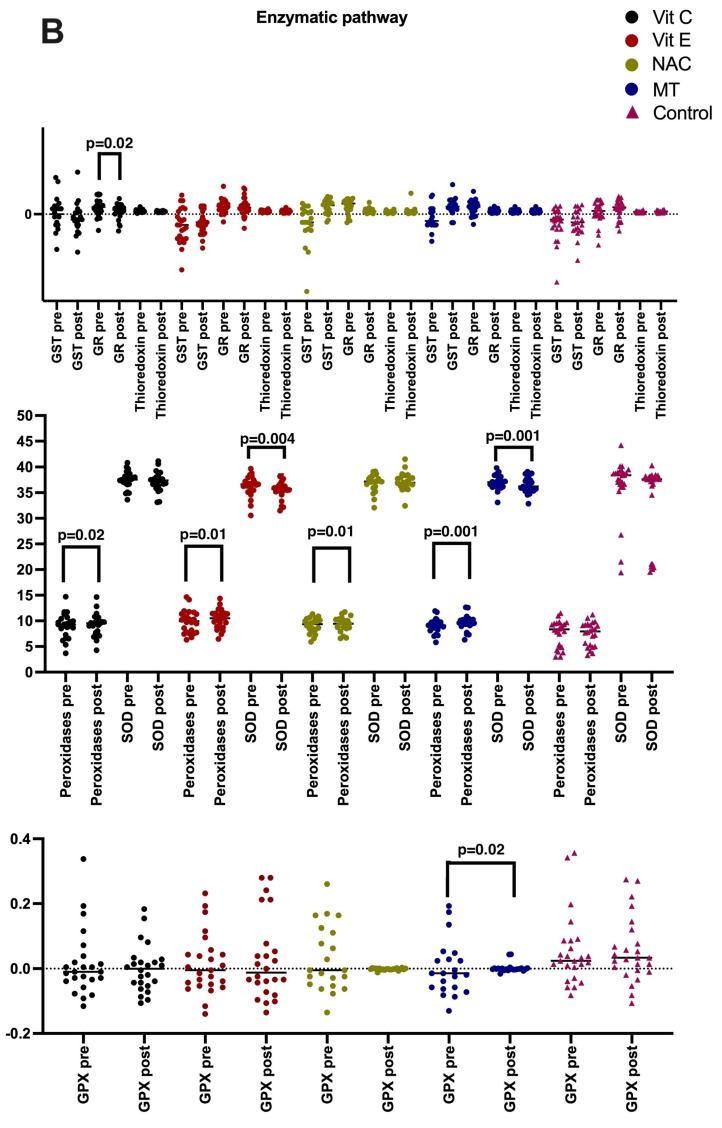
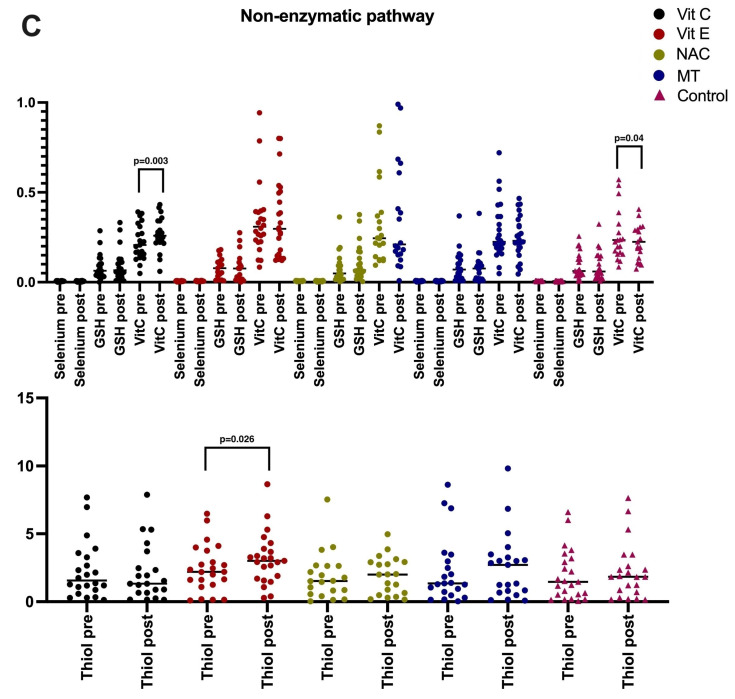
Figure 1.
(A) Values of oxidative stress markers before and after antioxidant therapy. Groups: Vit C (n = 25), Vit E (n = 27), NAC (n = 24), MT (n = 26), and control (n = 29). Vit C: vitamin C; LPO: lipoperoxidation (nmol MDA/mL); TAC: total antioxidant capacity (TroloxnM/mL); Thiol (µM/mL); Nitrates and Nitrites (HNO3−/NO2− nmol/mL of serum). Carbonylation (ngcarbonyl/mL); (B) Enzymatic pathway before and after antioxidant therapy. Peroxidases, (U/L) SOD: superoxide dismutase (U/mgL); (C) Enzymatic pathway before and after antioxidant therapy. GPX: glutathione peroxidase (µmol of NADPH/min/mL); GSH: glutathione (µM/mL of serum); GST: (µM/mg/protein); GR: glutathione reductase (U/min/mL Thioredoxin (µM/mg/protein).


