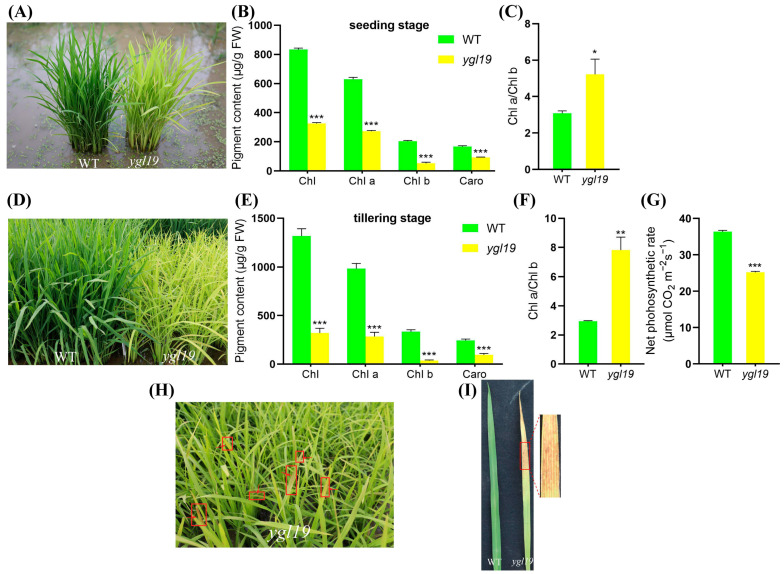
Figure 1.
Phenotypic comparison of wild-type and ygl19 mutant plants. (A) Plants at the seedling stage in the paddy field. (B) Contents of photosynthetic pigments (Chl, Chl a, Chl b, and Caro) in leaves at the seedling stage. (C) Chlorophyll a/b ratio at the seedling stage. (D) Plants at the tillering stage in the paddy field. (E) Contents of photosynthetic pigments (Chl, Chl a, Chl b, and Caro) in leaves at the tillering stage. (F) Chlorophyll a/b ratio at the tillering stage. (G) Comparison results of net photosynthetic rate. (H) Phenotype of the ygl19 plants and lesion leaves at the tillering stage (indicated by red arrow). (I) Spot phenotype on ygl19 leaves with wild type as control. WT, wild type. All data represent the mean ± SD of three biological replicates, and asterisks indicate statistically significant differences between ygl19 and wild-type plants (* p < 0.05, ** p < 0.005, *** p < 0.0005, Student’s t-test).

