
Figure 2.
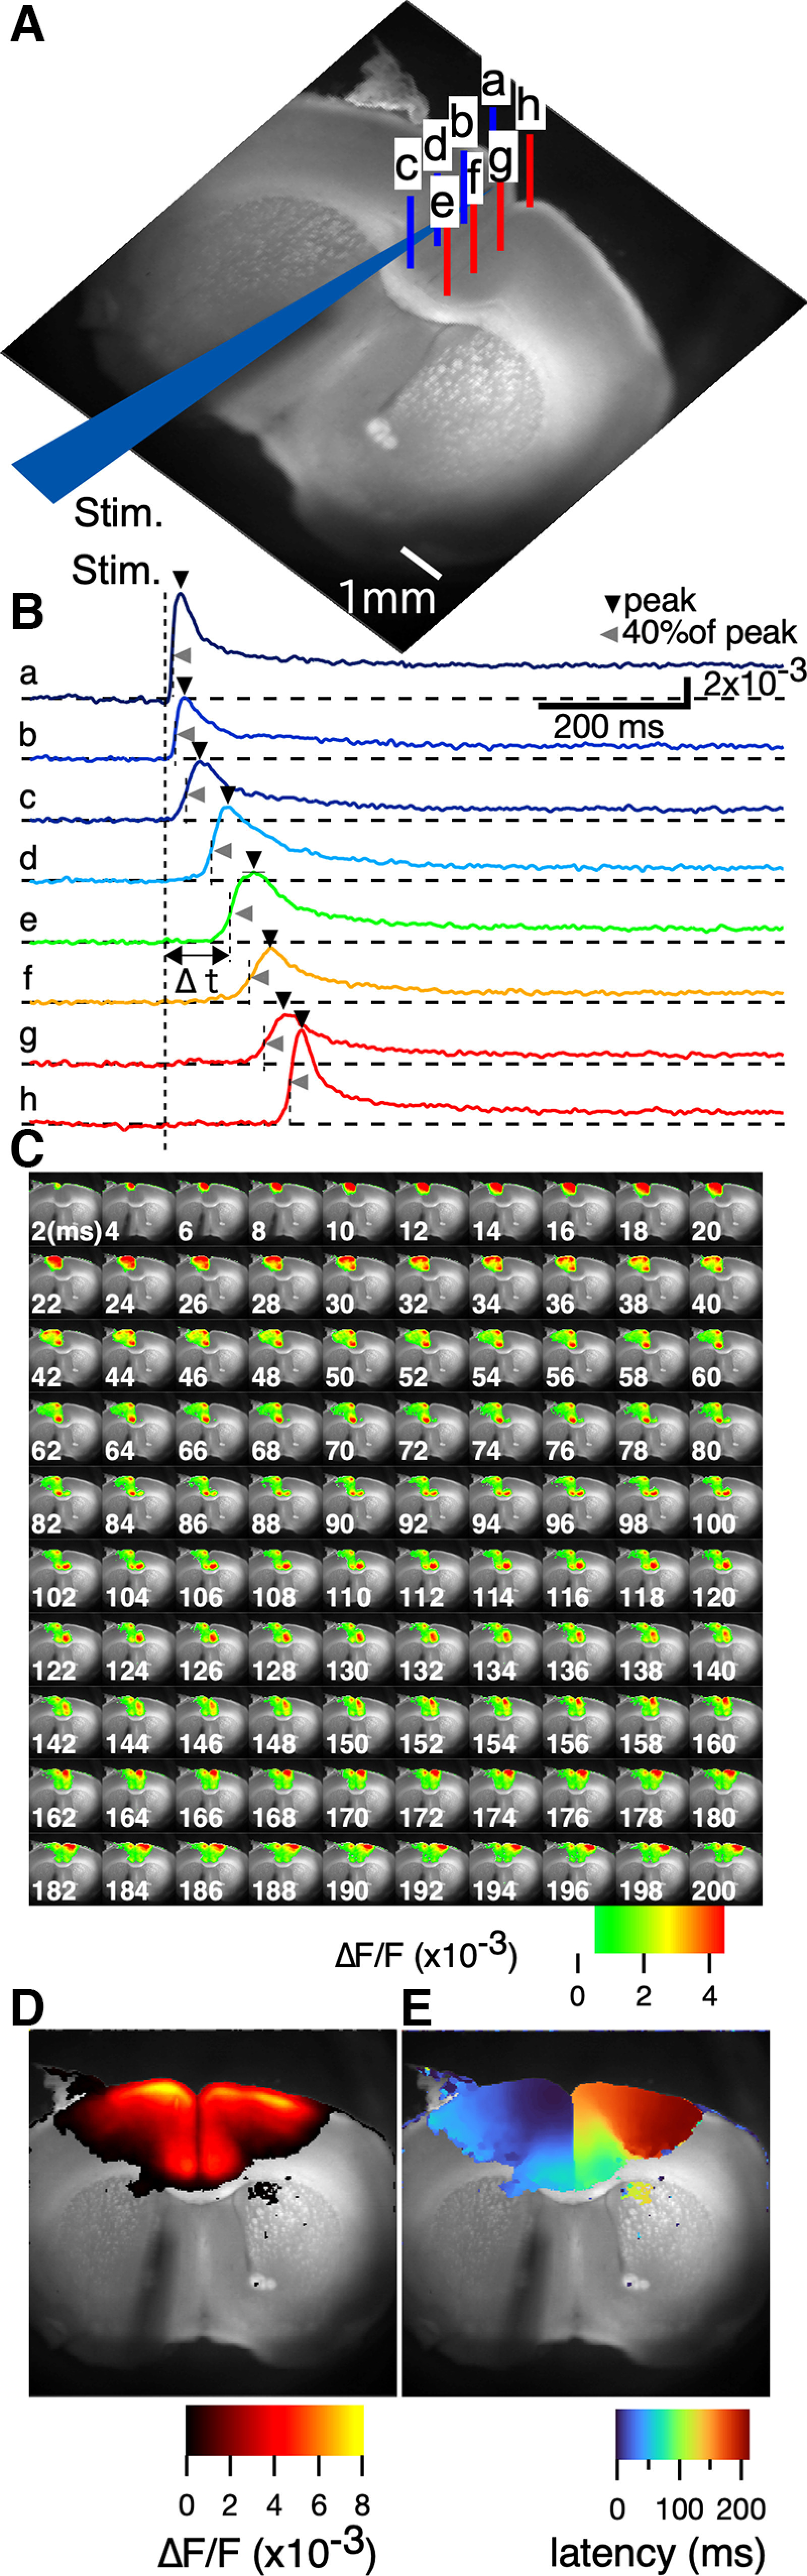
Contralateral spread of activity after electrical stimulation to the ACC. Aa–h, Configuration of SL 3 (obtained 0.98 mm from the bregma) and the stimulation electrode. Ba–h, Traces showing the optical signals at each pixel shown in Aa–h. The vertical dotted line shows the timing of the stimulation (Stim.; 40 V, 300 μs bipolar). C, Pseudocolored consecutive images of the optical signal at each time section (frame rate, 1 ms/frame). The numbers in the images indicate the time (ms) after the stimulation. D, Color-coded projection of the peak values of each optical signal at each pixel in the field of view. E, Color-coded projection map of the latency (Δt in B; time to 40% of peak) to the initial response from stimulation time at each pixel in the field of view.