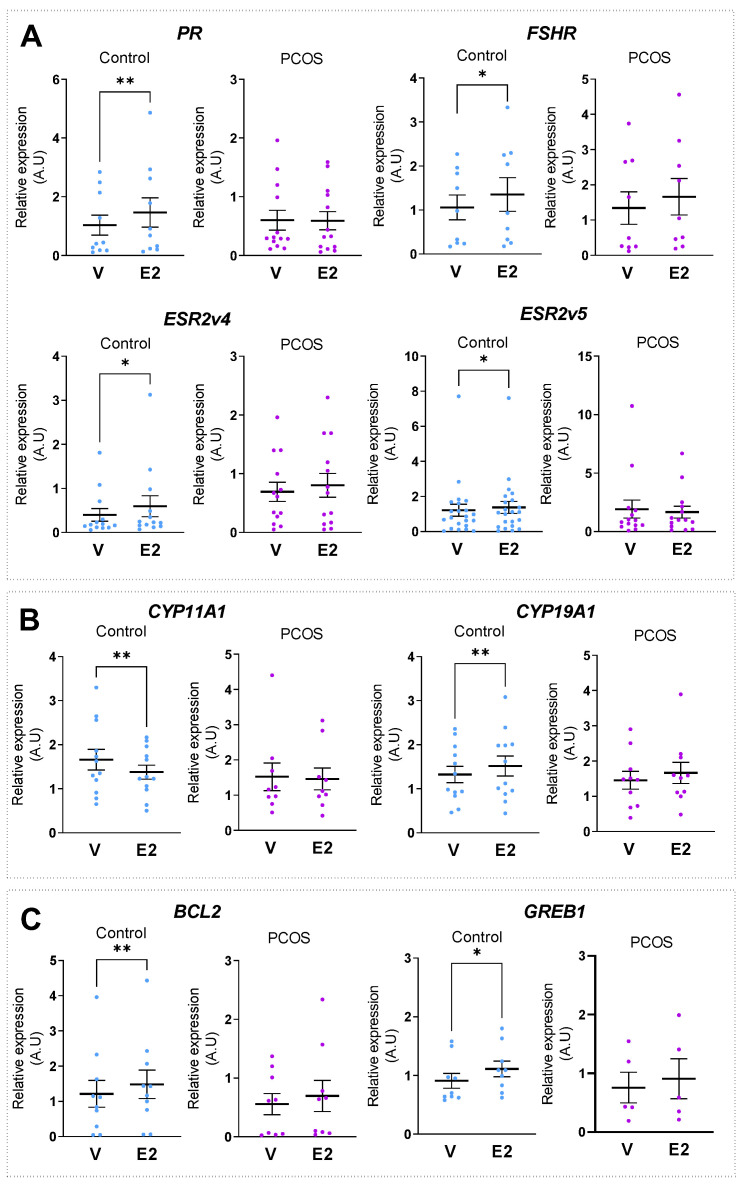
Figure 2.
E2 does not regulate E2 target gene expression in GCs from PCOS follicles. Cultured GCs, collected from control and PCOS patients, were treated for 24 h with either vehicle (V) or 10 nM E2. Twenty-four hours later, the relative levels of (A) steroid receptors PR, ESR2v4, ESR2v5 and FSHR (B) steroidogenic enzymes CYP11A1 and CYP19A1 and (C) cell growth regulators BCL2 and GREB1 mRNAs were determined via RT-qPCR analysis for each group. Transcript levels were normalized to GAPDH transcript abundance. Values are represented as means ± SEM (n = 5–14) from two or three identical wells per patient, measured in triplicate. Differences between treated or untreated groups were considered significant for p ≤ 0.05 * and p ≤ 0.01 ** by two-sided Wilcoxon signed-rank test. A.U., Arbitrary Units.

