Figure 2.
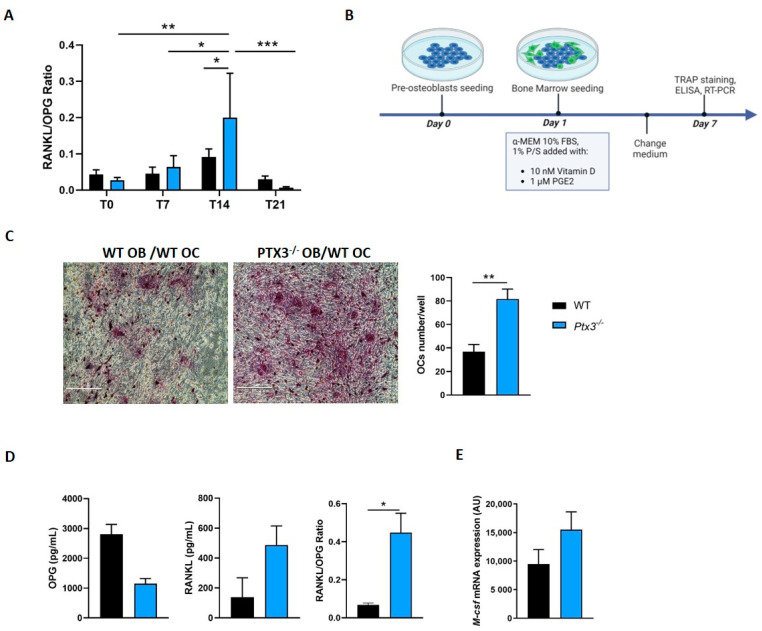
Effect of Ptx3 genetic deficiency on OB-induced osteoclastogenesis. (A) RANKL/OPG ratio in the supernatant of WT and Ptx3−/− OB cultures in basal conditions and at different timepoints of osteogenic induction. RANKL and OPG were quantified using dedicated ELISA kits (3 independent experiments performed in duplicate, n = 6, mean ± SEM). Two-way ANOVA with multiple comparison test; * p < 0.05, ** p < 0.01, *** p < 0.001. (B) Schematic representation of the protocol for coculture experiments. (C) Representative images of TRAP-stained OCs formed after coculture of WT or Ptx3−/− OBs with WT bone marrow cells for 7 days. Images were taken with an EVOS microscope at 20× magnification; scale bar: 200 μm. TRAP+ multinucleated (nuclei number ≥ 3) OCs were counted by a blind operator and expressed as number of mature OCs per well. Mann–Whitney test; ** p < 0.01. (D) RANKL, OPG, and RANKL/OPG ratio in the supernatant of the cocultures described in C. The conditioned medium was collected from each well after 7 days of coculture (2 independent experiments performed in triplicate, n = 6, mean ± SEM). Mann–Whitney test; * p < 0.05. (E) Analysis of M-csf expression in the coculture setting described in (C) after 7 days of coculture; mRNA levels were determined by qPCR. Results were normalized based on Gapdh expression and expressed as arbitrary units (AU). Mann–Whitney test.

