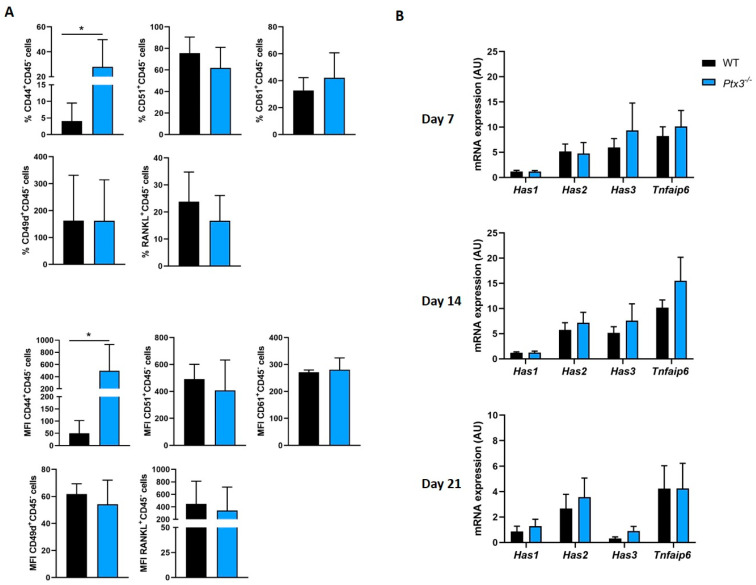
Figure 3.
(A) FACS analysis of the indicated surface markers on WT and Ptx3−/− KO OBs in basal condition (not treated with oim). The percentage of CD45- cells expressing each marker as well as the mean fluorescence intensity for each marker in both genotypes is indicated as mean ± SEM. Mann–Whitney test; * p < 0.05. (B) Gene expression analysis of the hyaluronic acid synthases Has1, Has2, and Has3 and Tnfaip6 gene in WT and Ptx3−/− OBs at different timepoints during osteogenic induction; mRNA levels were determined by qPCR and normalized on Gapdh expression, and they are indicated as arbitrary units (AU) (3 independent experiments performed in duplicate, n = 6, mean ± SEM). One-way ANOVA.

