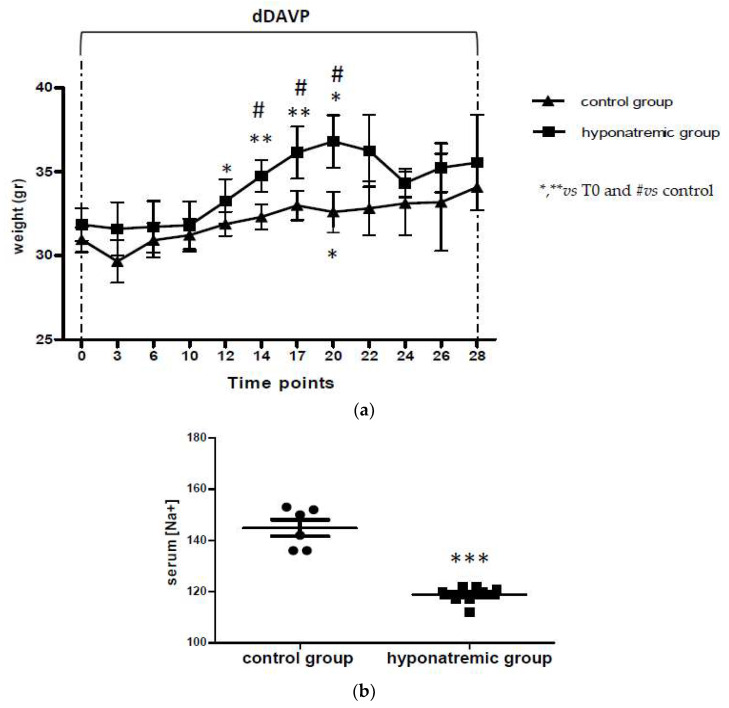
Figure 1.
Body weight and serum [Na+]. (a) Body weight fluctuations in the two experimental groups. Results are expressed as mean ± SE. * p ≤ 0.05, ** p ≤ 0.02 vs. T0 and # p ≤ 0.05 vs. control group. (b) Serum [Na+] (mEq/L) in control group and hyponatremic group. Results are expressed as mean ± SE. *** p ≤ 0.002 vs. control group.

