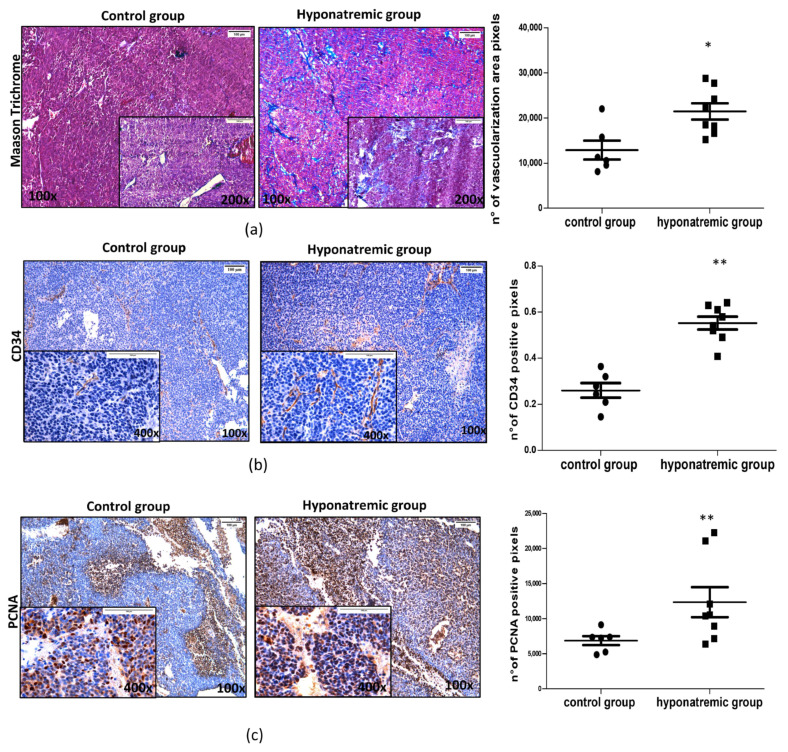
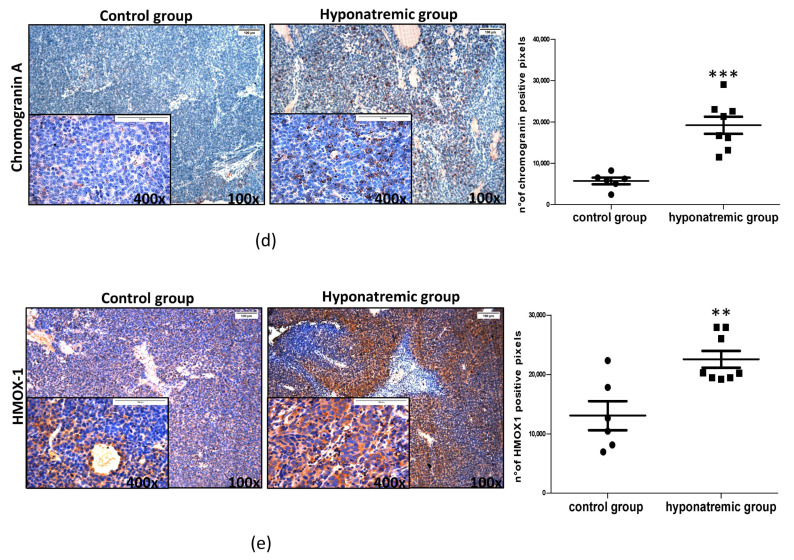
Figure 5.
Masson’s Trichrome and immunohistochemical staining of tumor masses. Representative images of tumor masses sections of one control and one hyponatremic mouse. (a,b). Increased vascularization is evidenced by Masson’s Trichrome staining and immunohistochemical analysis for CD34. In the bar graphs, densitometric analysis of positive pixels of vascularization area (aniline blue positive cells) and CD34 positive cells are represented. Results are expressed as mean ± SE. * p ≤ 0.05, ** p ≤ 0.02 vs. control group. (c) Immunohistochemical analysis of PCNA. In the bar graph, densitometric analysis of positive pixels of PCNA positive cells is represented (** p ≤ 0.02 vs. control group). (d) Immunohistochemical analysis of chromogranin A. In the bar graph, densitometric analysis of positive pixels of chromogranin A positive cells is represented (*** p ≤ 0.002 vs. control group). (e) Immunohistochemical analysis of HMOX-1. In the bar graphs, densitometric analysis of positive pixels of HMOX-1 positive cells is represented (** p ≤ 0.02 vs. control group). All results are expressed as mean ± SE.


