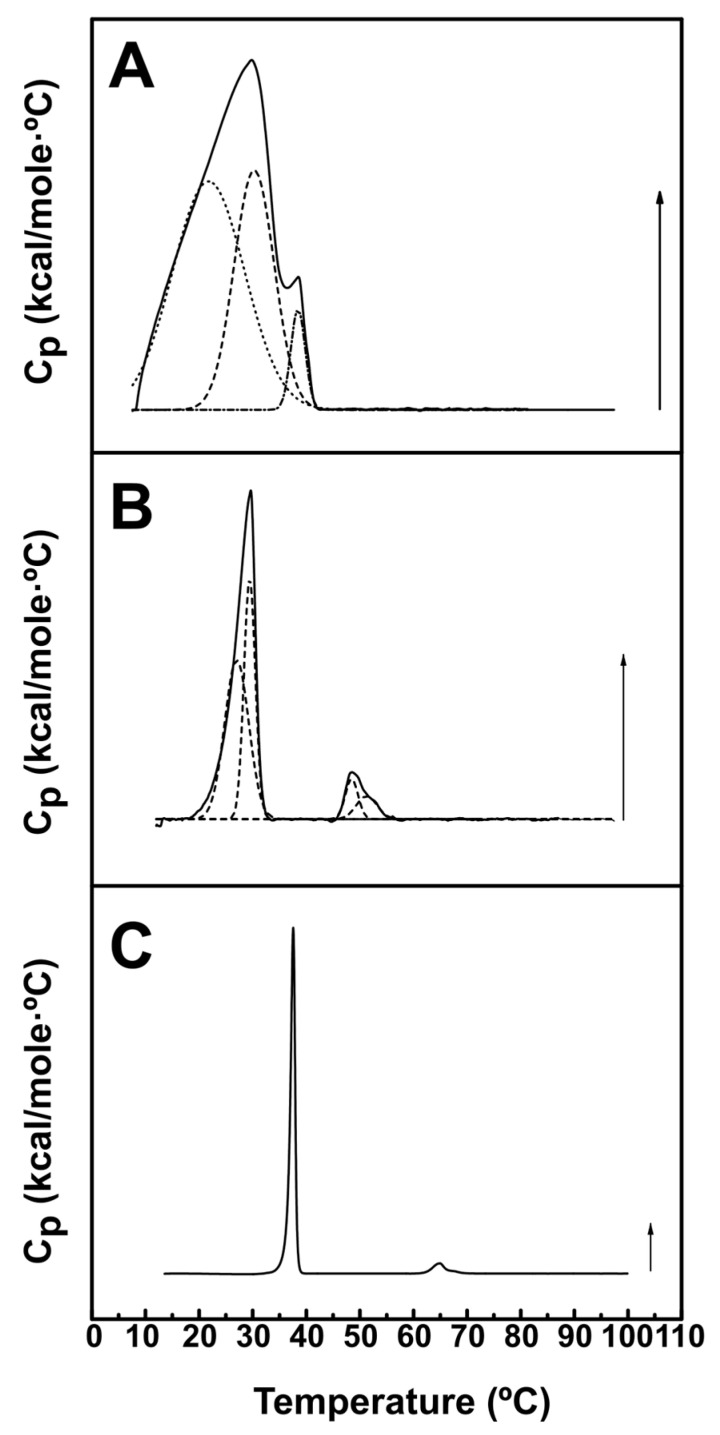
Figure 2.
Representative DSC thermograms of lipid:water mixtures based on DEPE. Panel (A): DEPE:DOPEmal (70:30). Panel (B): DEPE:DOPE (70:30), and Panel (C): pure DEPE. Arrows: 0.120 kcal/mol·°C for DEPE:DOPEmal (70:30) and DEPE:DOPE (70:30), and 1.22 kcal/mol·°C for DEPE. The dashed lines indicate the Gaussian components providing the best fit to the experimental overall thermograms.

