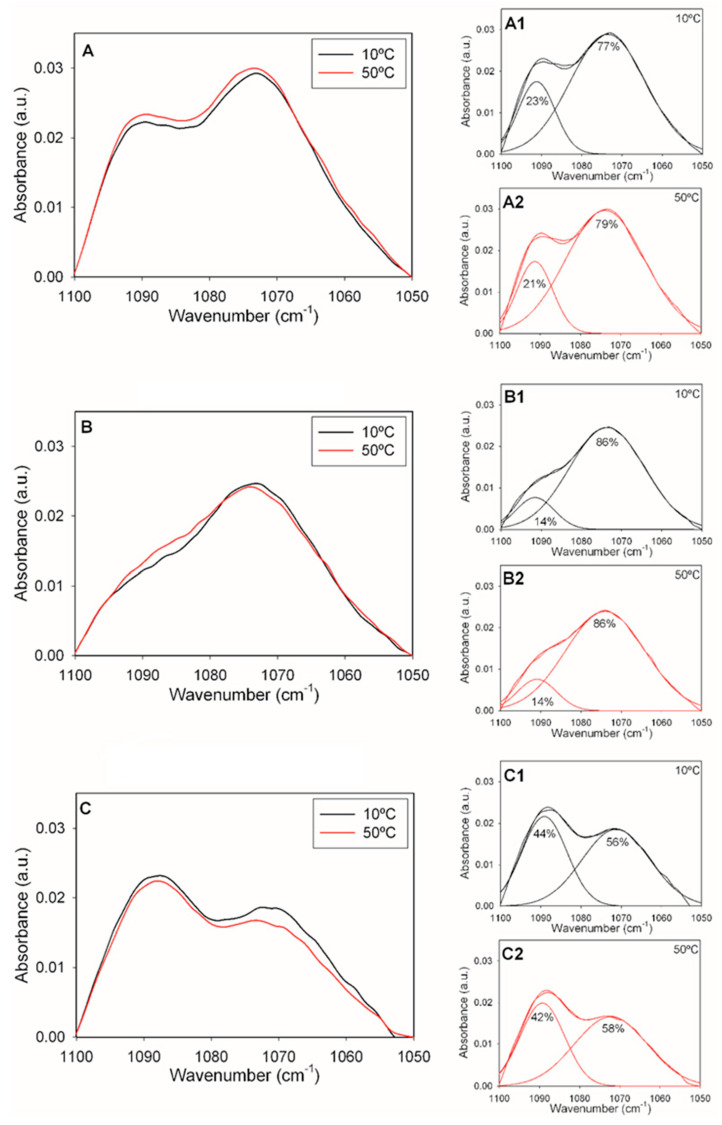
Figure 3.
The phosphate band region (1100–1050 cm−1) of the IR spectrum of aqueous dispersions of (A) DOPE-mal, (B) ePC:DOPE:PI (35:55:10) or (C) ePC:DOPE:DOPEmal:PI (35:25:30:10). (A1,A2) DOPE-mal spectra, respectively, at 10 and 50 °C, each fitted to two components. (B1,B2) ePC:DOPE:PI spectra, respectively, at 10 and 50 °C, each fitted to two components. (C1,C2) ePC:DOPE:DOPEmal:PI spectra, respectively, at 10 and 50 °C, each fitted to two components. The percentage fractional areas are indicated for each component.

