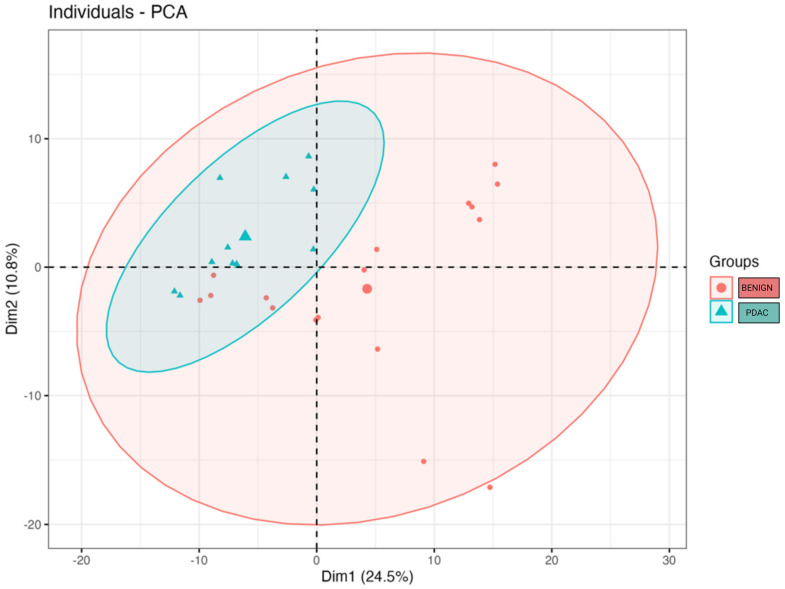
Figure 3.
Microbial beta diversity significantly differs between bile from individuals with PDAC vs. bile from individuals with benign samples (p = 0.0173). The clusters were visualised by plotting the first two components that explain up to 35.3% of the variation in the sample space. The large blue triangle and the large red dot represent the centroids of the PDAC and benign sample groups.

