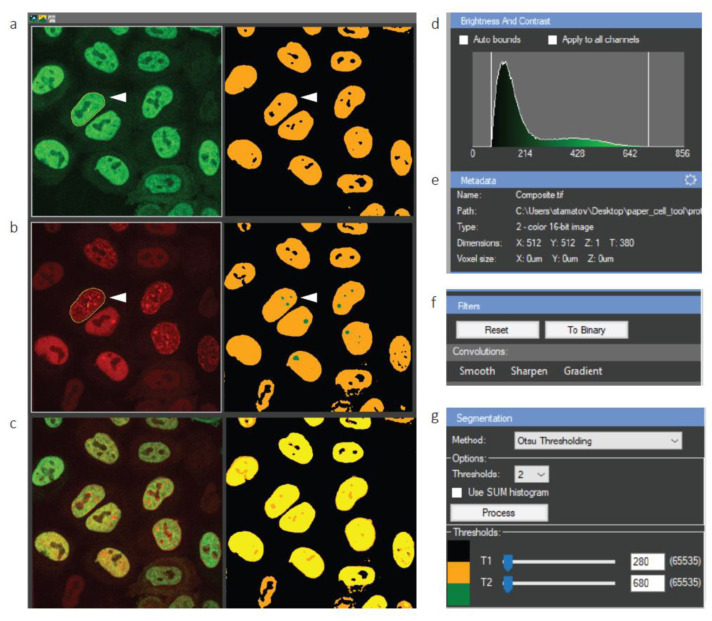
Figure 2.
Tracking cell nuclei from a large field of view in CellTool. (a–c) Display of the raw data (left) and processed image (right). White arrowheads denote a cell of interest tracked over time; (a) GFP channel; (b) mCherry channel; (c) merged; (d) brightness and contrast settings of the raw image; (e) metadata, which can be edited (adjustment wheel in the top right corner); (f) image filters panel; (g) segmentation panel with a number of adjustable parameters.

