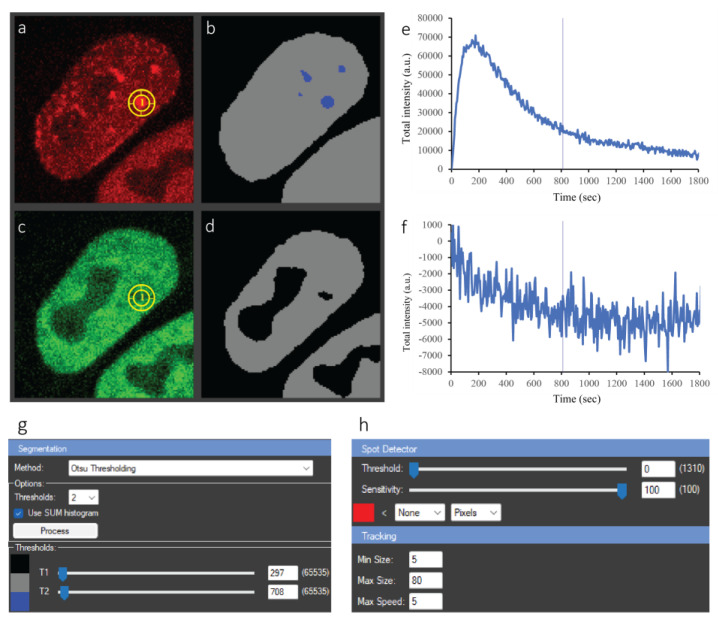
Figure 4.
Analysis of ALKBH2 and PCNA dynamics after micro-irradiation of a single cell. (a) Raw PCNA-mCherry signal; yellow circle—tracked circular ROI of the damage focus; (b) segmentation result of (a) with two thresholds. Grey—whole nucleus, blue—foci. (c) Raw ALKBH2-EGFP signal; yellow circle—tracked ROI from the PCNA image, copied over to the same spatial coordinates on GFP. (d) Segmentation result of (c) with one threshold—depletion in the signal appears as holes. (e,f) Plots of the ROI intensity of the two channels over time. The straight line indicates the currently selected timepoint, to which the images in (a,c) correspond. (g) Segmentation panel; (h) tracking panel. All these items appear in a single window in CellTool, but are shown separately here for clarity.

