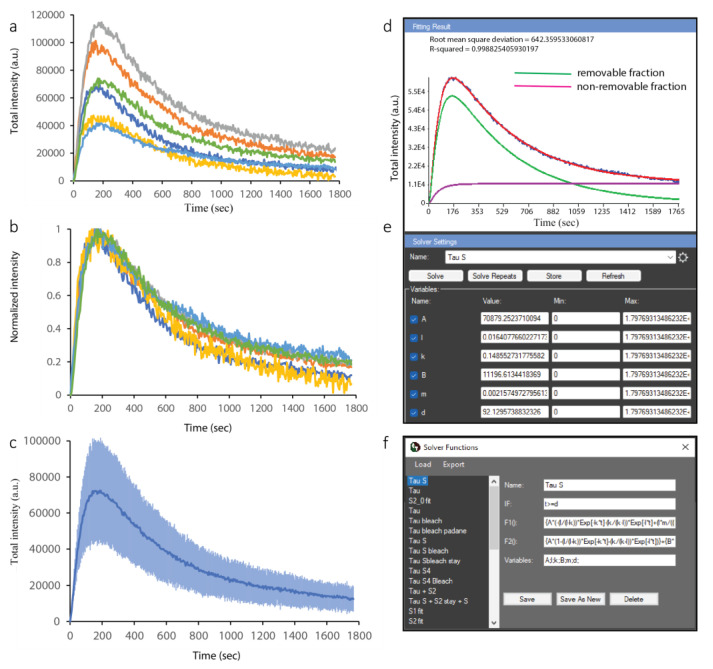
Figure 5.
Analysis of PCNA data from multiple cells in the CellTool Results Extractor. (a) Original curves for PCNA recruitment in micro-irradiated cells. Curves with different colors are derived from different cells. (b) Normalized PCNA recruitment curves. (c) Averaged PCNA recruitment curve; the standard deviation is shown in a lighter shade of blue. (d) Fitting of the mathematical model (red) to the average curve (blue). The model is a combination of two components (green, purple). (e) The fitting interface, where initial values are chosen, and the fit are optimized automatically. (f) A pop-up window allows for the selection of a pre-existing model or the definition of a new one. All these items, except the pop-up window in (f), appear in a single window in CellTool, but are separated here for clarity.

