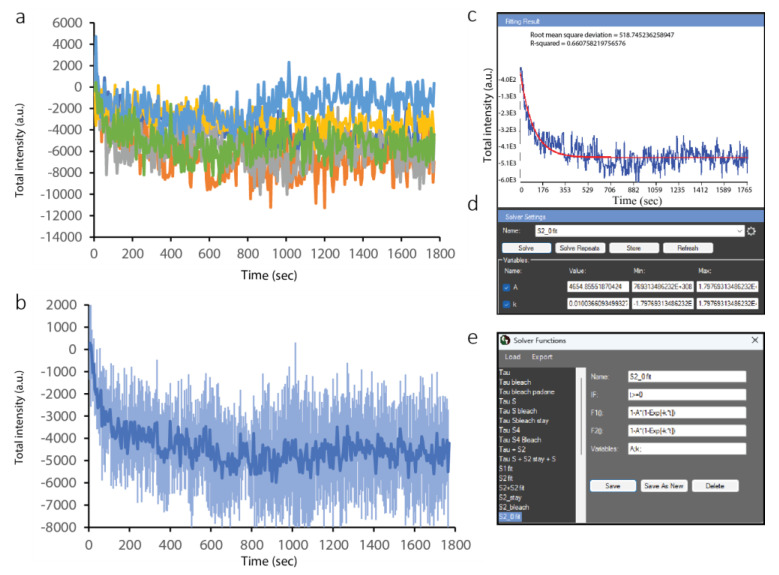
Figure 6.
Analysis of ALKBH2 data from multiple cells in the CellTool Results Extractor. (a) Original curves for ALKBH2 depletion at the site of damage. Curves with different colors are derived from different cells. (b) Average ALKBH2 depletion curves. (c) Fitting of the mathematical model (red) to the average curve (blue); (d) fitting interface; (e) model selection interface.

