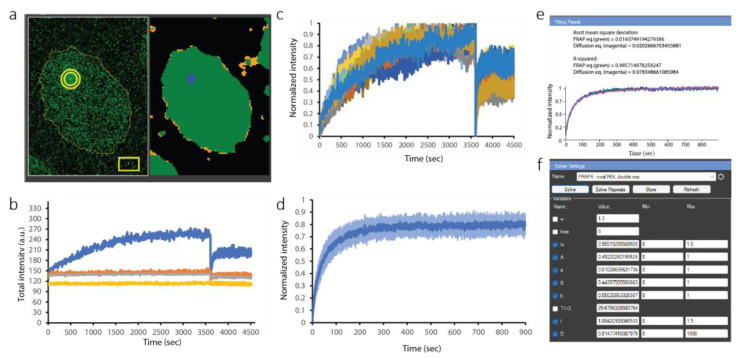
Figure 7.
FRAP analysis in CellTool. (a) Left panel: original BARD1-EGFP signal. Yellow circle—ROI of the damage focus; yellow rectangle—ROI to measure the out-of-cell background. Thin yellow line—ROI of the cell shape. Right panel: segmentation of the image, with the damage focus in blue. (b) Representative plot of the ROIs in (a): total intensity within the ROI over the micro-irradiated region in blue; orange represents the intensity in the outer shell of this ROI; gray represents the ROI covering the whole nucleus; and yellow represents the rectangular ROI in the lower right corner (background). (c) Combined view of the BARD1-EGFP signal over time for all cells analyzed; the sudden drop in intensity indicates the moment of the FRAP. Curves with different colors are derived from different cells. (d) Isolated average recovery curve starting from the bleaching moment (right part of the curves in (c)). (e) Fitting of the mathematical model to the average recovery curve in (c), with the FRAP equation (green) and diffusion equation (magenta). (f) The fitting interface.

