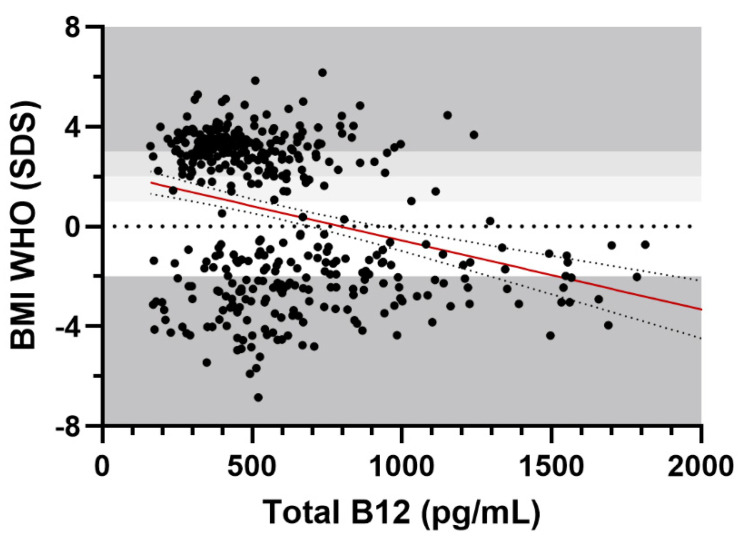
Figure 2.
Scatter plot of total vitamin B12 levels according to BMI SDS. Note: weight groups’ borders are demarcated in shades of grey, to indicate underweight, normal weight, overweight, obesity and severe obesity on the y axis. The best-fit line is represented in red, alongside its 95% confidence bands.

