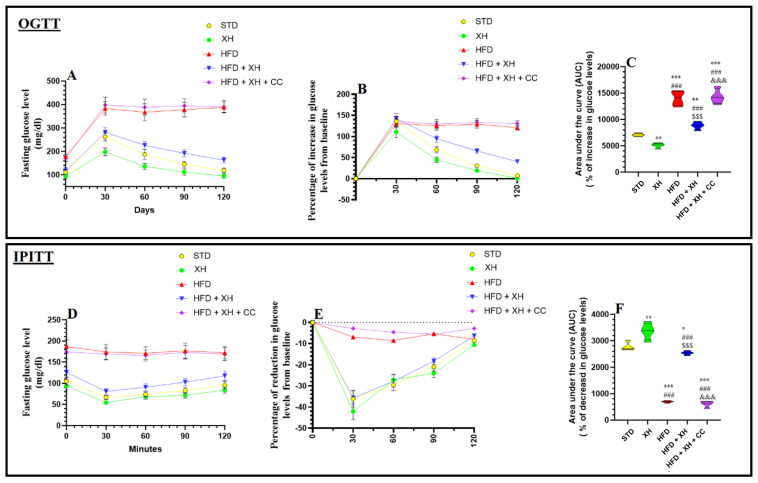
Figure 2.
Data of oral glucose (OGTT) (A–C) and intraperitoneal insulin tolerance tests (IPITT)(D–F) in all groups of rats. Data are presented as means ± SD for n = 8 rats/group. (*, **, ***): significantly differed with STD group at p < 0.05, 0.01, and 0.001, respectively; (###): significantly differed with XH-treated group at p < 0.001; ($$$): significantly differed with HFD group at p < 0.001; (&&&): significantly differed with HFD + XH group at p < 0.001. UAC: urea under the curve.

