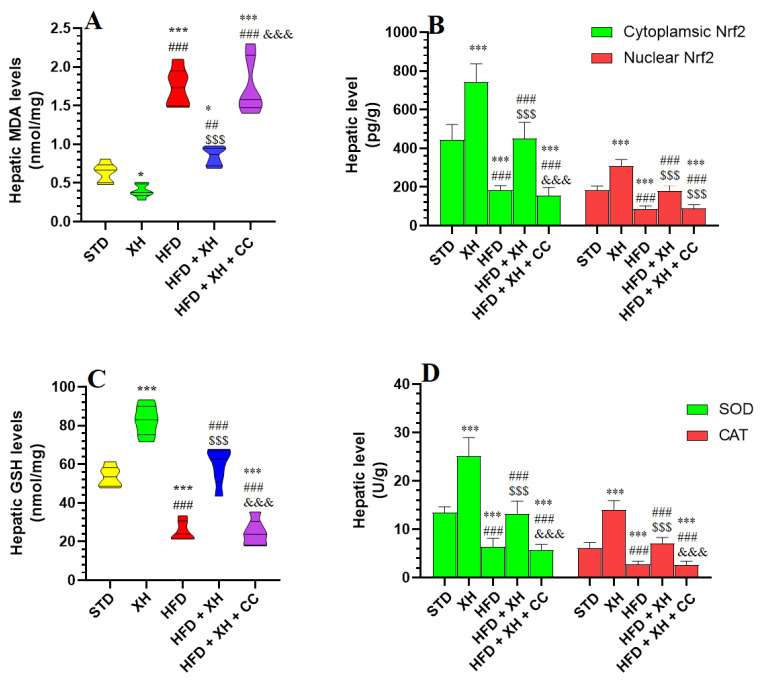
Figure 3.
Levels of malondialdehyde (MDA) (A), cytoplasmic and nuclear Nrf2 (B), total glutathione (GSH) (C), superoxide dismutase (SOD), and catalase (CAT) (D) in the livers of all groups of rats. Data are presented as means ± SD for n = 8 rats/group. (*, ***): significantly differed with STD group at p < 0.05, 0.01, and 0.001, respectively; (##, ###): significantly differed with XH-treated group at p < 0.001; ($$$): significantly differed with HFD group at p < 0.001; (&&&): significantly differed with HFD + XH group at p < 0.001.

