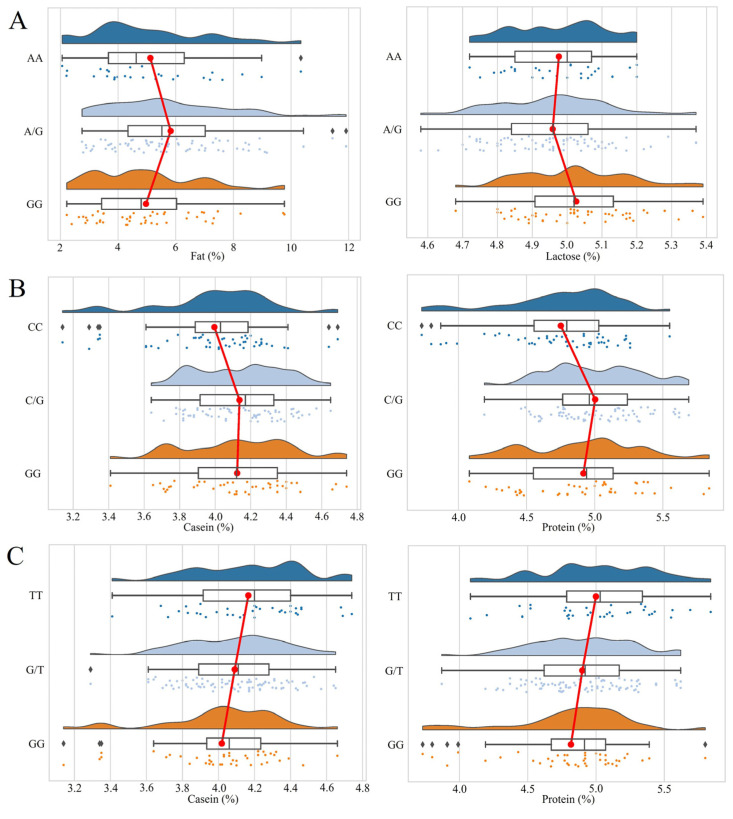
Figure 1.
Distribution of all the three genotypes of SNPs (the main significant milk production traits of Gannan yak). (A) g.183,843A>G, (B) g.222,717C>G, (C) g.388,723G>T. The red line represents the mean value of the milk quality trait corresponding to the three genotypes. The three different colored points represent the distribution of data.

