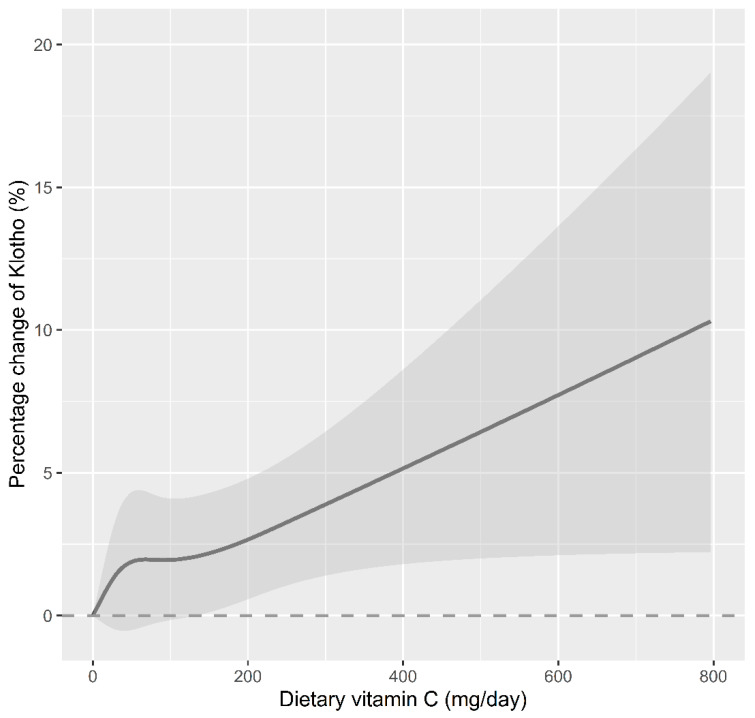
Figure 2.
The dose-response relationship between dietary vitamin C consumption and the percent change in Klotho concentration. Point value estimation (solid line) and 95% confidence interval calculation (dashed line) were estimated by a restrictive cubic spline analysis model, knotted at the 5th, 35th, 65th, and 95th percentiles. Age, sex, BMI, PIR, education attainment, ethnicity, serum cotinine, alcohol consumption, diabetes, hypertension, and dietary energy intake were adjusted in the model. p for non-linearity is 0.510.

