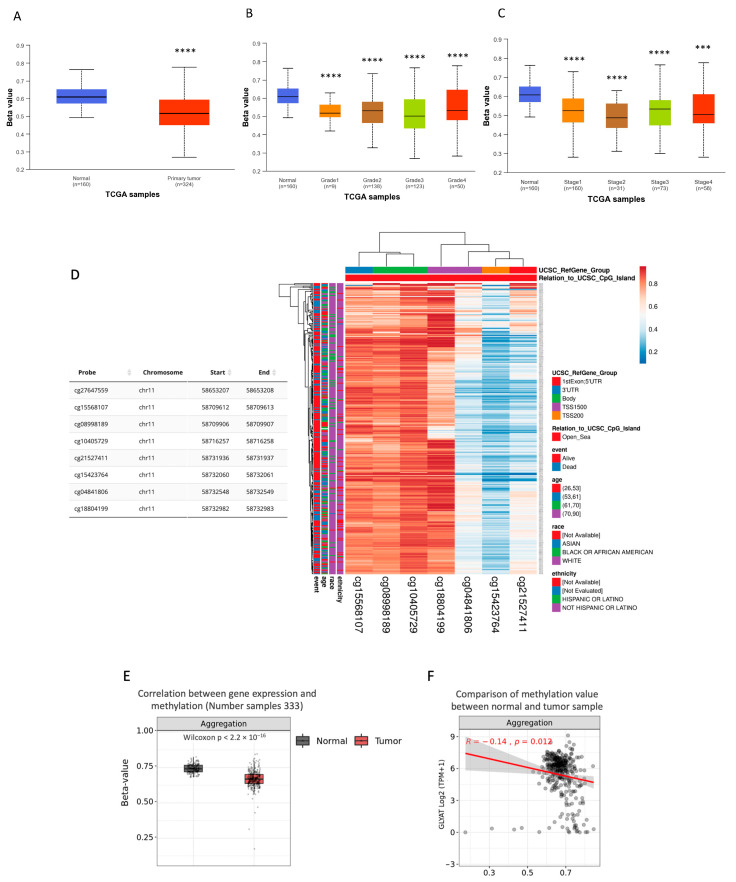
Figure 5.
GLYAT promoter is hypomethylated in KIRC cases. (A) Data from the TCGA project show the relative DNA methylation in GLYAT promoter based on the beta-value, ranging from 0 (unmethylated) to 1 (fully methylated). (B) Methylation levels of the GLYAT promoter in different tumor grades in KIRC cases from the TCGA project. (C) Methylation levels of the GLYAT promoter in different cancer stages in KIRC cases. Plots were obtained and modified from the UALCAN Web tool. (D) Heat map showing the methylation levels of the GLYAT gene in predicted CpG sites in different genomic regions. The color scale ranges from red (high methylation) to blue (low methylation). The side-boxes show the event, age, race, and ethnicity of the samples. Data were obtained from MethSurv and modified by the ClustVis tool. The visualization of CpG site cg27647559 on the heat map was not available on the database. (E) Differential methylation levels of GLYAT probes between normal samples (n = 157) and KIRC patients (n = 333) from the TCGA project. (F) Spearman’s correlation between methylation and mRNA level (Log2-scaled, TPM + 1) of GLYAT in KIRC samples. Data were obtained from TCGA project and analyzed by Methsurv Web tool. *** p < 0.001, and **** p < 0.0001.

