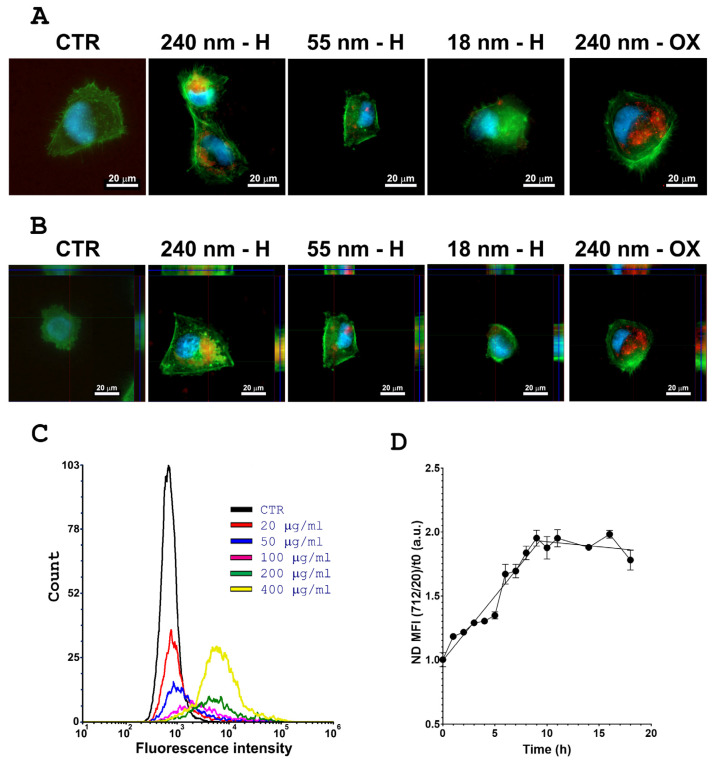
Figure 2.
Qualitative analysis of the cellular uptake of NDs by human DAOY cells through fluorescence microscopy: (A) Comparison of DAOY cells after 13 h incubation in MEM containing FBS (10% unless otherwise specified) at 37 °C, respectively, without NDs (CTR), 240 nm H- and OX-NDs, 55 nm H-NDs and 18 nm H-NDs, at a particle concentration of 20 μg mL−1. The images show the natural fluorescence signal of NDs in red overlapped with the stained nuclei in blue (DAPI) and cell cytoplasm in green (Phalloidin). The scale bar is 20 μm. (B) Cross-sectional fluorescence images of the treated and untreated (CTR) DAOY cells. (C) Flow cytometry Analysis for MB cells treated with different concentrations of 55 nm H-NDs (CTR black, 20 µg/mL red, 50 µg/mL blue, 100 µg/mL purple, 200 µg/mL green, and 400 µg/mL yellow). Relative fluorescence in the 712/20 channel is reported in the x-axis while the number of events is reported in the y-axis. (D) Uptake curve for 20 µg/mL 240 nm H-NDs analysed using flow cytometry and represented as the Median Fluorescence Intensity (MFI) normalized to the untreated controls.

