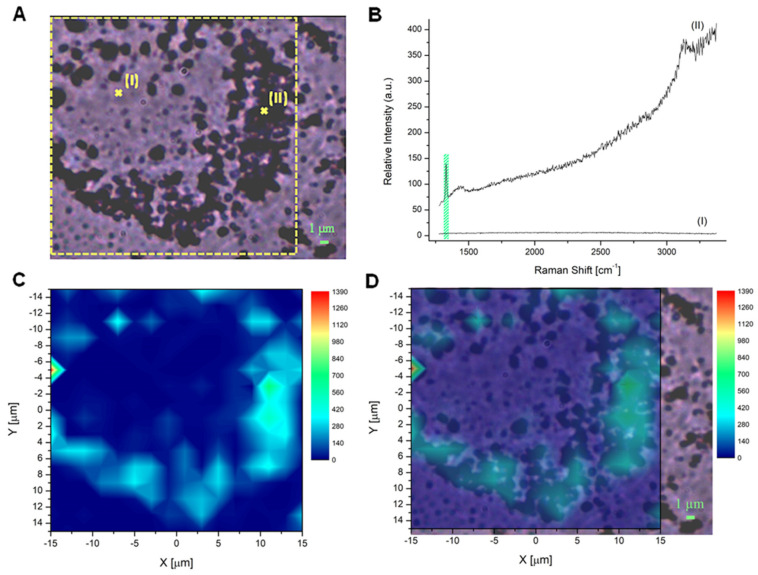
Figure 3.
OX-ND localization in DAOY cell cultures using Raman mapping. (A) Bright-field image of a cell incubated with a concentration of 20 μg mL−1 240 nm OX-NDs. The yellow dotted square represents the area considered for mapping (scale bar 1 μm). (B) Raman spectra measured in point (I) and point (II) in (A), showing the typical first-order diamond Raman peak around 1332 cm−1 in point (II). The area delimited by the green rectangle represents the Raman shift interval between 1312 cm−1 and 1345 cm−1, considered to define the baseline to be subtracted from the data in order to avoid the luminescence background. The same interval was employed to evaluate the peak integral and for the subsequent reconstruction of the map reported in (C). (C) The 16 × 16 Raman map (resolution < 2 μm) of the intensity distribution of the diamond Raman peak, evaluated as the area of the peak in the region of the Raman shift between 1312 cm−1 and 1345 cm−1. The area covered by the map corresponds to the yellow square outlined in (A). (D) Merged image of (A,C).

