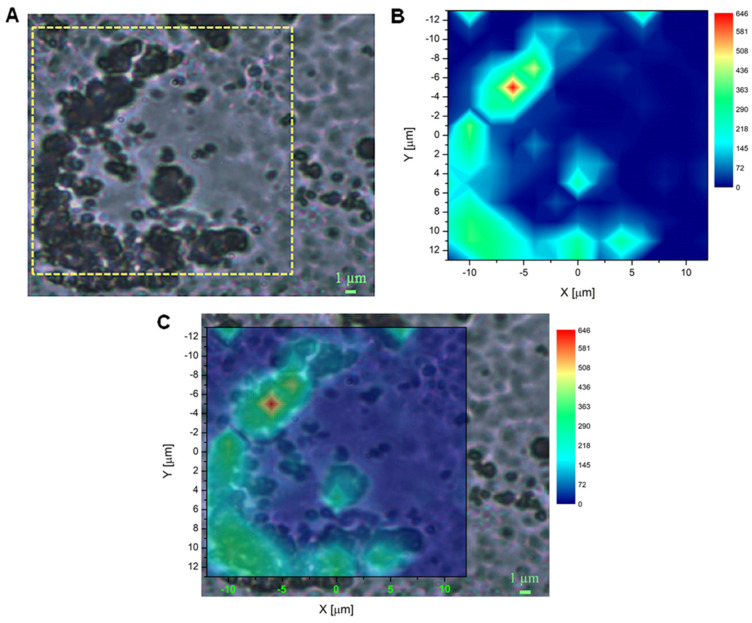
Figure 4.
H-ND localization in DAOY cell cultures using Raman mapping. (A) Bright-field image of a cell incubated with a concentration of 20 μg mL−1 240 nm H-NDs. The yellow dotted square represents the area considered for mapping (scale bar 1 μm). (B) The 13 × 14 Raman map (resolution < 2 μm) of the intensity distribution of the diamond Raman peak, evaluated as the area of the peak in the region of the Raman shift between 1309 cm−1 and 1335 cm−1. The area covered by the map corresponds to the yellow square outlined in (A). (C) Merged image of (A,B).

