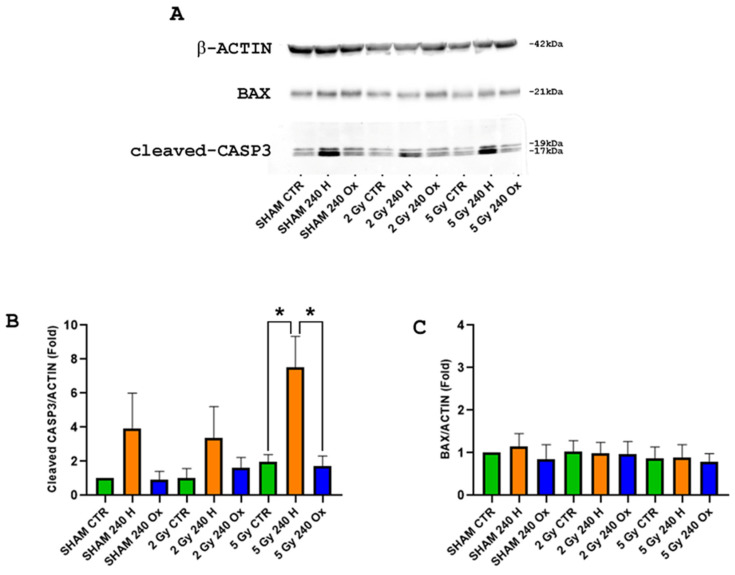
Figure 7.
Western blot analyses showing representative images of Caspase-3, Bax and β-actin protein expression in DAOY cells from the sham, 240 nm H-NDs, and 240 nm OX-NDs exposed to 0, 2 and 5 Gy (n = 3) at 3 h post-irradiation. Band signals of target genes were normalized to those of β-actin. (A) The expression of the large cleavage form (17 kDa) of Caspase-3 increased significantly in DAOY cells treated with H-NDs and exposed to 5 Gy γ-rays. Bax was not modulated. (B,C) Quantification of Caspase-3 and Bax protein levels, showing fold changes vs. the sham controls. Student’s t test was performed. * p < 0.05.

