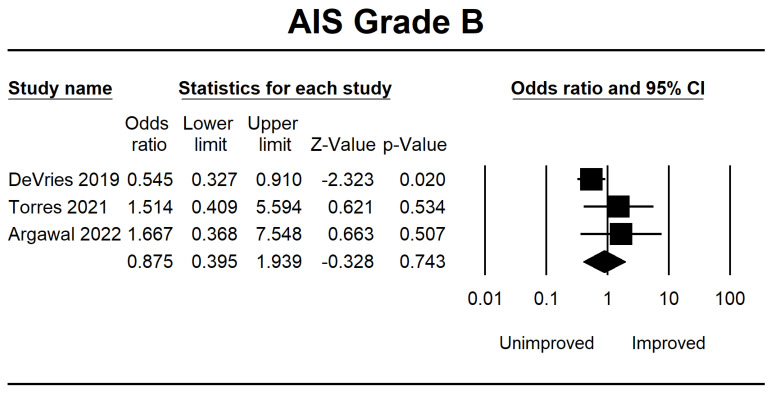
Figure 4.
Forest plot of AIS grade B using OR ratio analysis between unimproved and improved prediction groups. The square box represents the point estimate for the respective study, while the horizontal line is the 95% CI. The diamonds represent pooled results. DeVries et al., 2009 [38]; Torres et al., 2021 [39]; Agarwal et al., 2022 [40].

