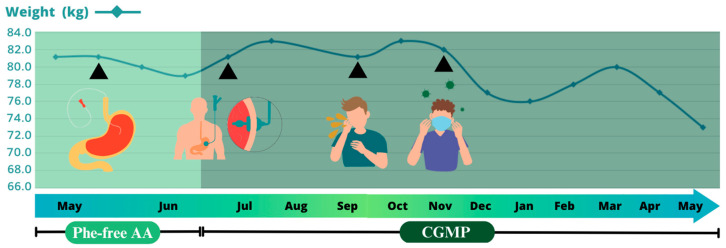
Figure 1.
Patient’s weight evolution throughout the EN plan. The first arrowhead indicates EN start through a nasal gastric tube. The second one represents percutaneous gastrostomy placement by intervention radiology. The third arrow indicates his weight when he presented vomiting episodes due to the requirements of a higher Phe and protein intake. The last one coincides with COVID-19.

