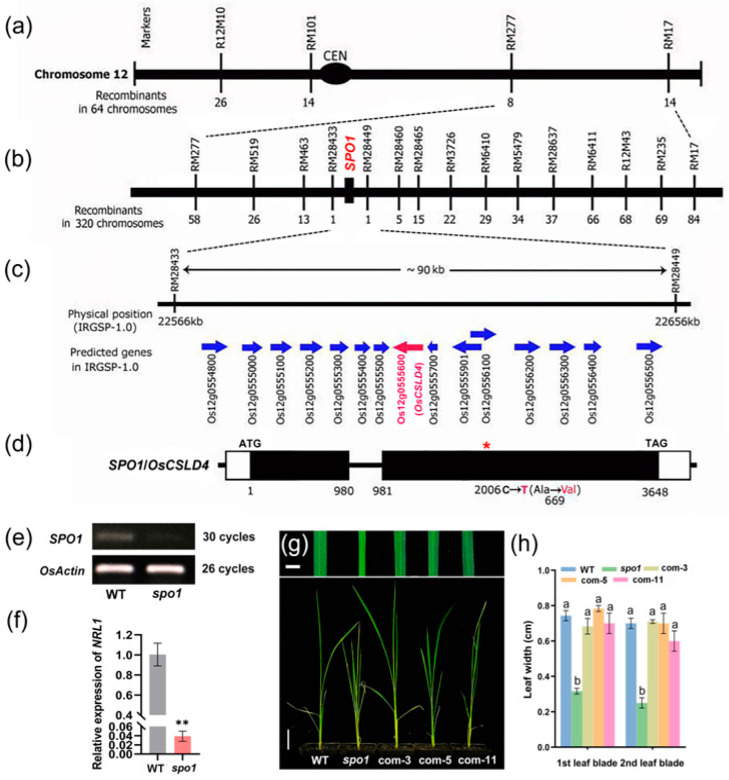
Figure 2.
Map-based cloning of SPO1. (a) Linkage map of the gene SPO1 on the long arm of chromosome 12. (b) Fine-mapping of the SPO1 locus. The genetic linkage map is derived from 32 F2 mutant individuals and 160 F2 mutant individuals for fine-mapping. Marker names are above the vertical lines and the number of recombinants is displayed under the vertical lines. (c) According to IRGSP1.0 database annotation, the 90-kb region contains 15 annotated genes. (d) Gene structure of SPO1/OsCSLD4/Os12g0555600 and the corresponding positions of intron and exons. The white boxes indicate the 5′ and 3′ untranslated regions, the black boxes indicate the exons, and the black line between the two black boxes indicate the intron. The start codon (ATG) and the stop codon (TAG) are indicated. The spo1 mutant has a base substitution (C to T) in the second exon at position 2006 of the coding regions. (e) RT-PCR analysis of SPO1 expression in spo1. (f) qRT-PCR analysis of SPO1 expression in spo1. Data are means ± SD, asterisks indicate significant differences according to Student’s t-test (** p < 0.01). (g) Genetic complementation of spo1. Three representative lines (com-3, com-5, and com-11) of complementation with young plants are shown. (h) Statistical analysis of the leaf blades width of WT, spo1, and complementary lines (com-3, com-5, and com-11) at seedling stage. Data presented are means ± SD: different letters indicate significant differences between means, according to Duncan’s multiple range test (5% α). Scale bars: (g) 0.6 cm and 4 cm, respectively.

