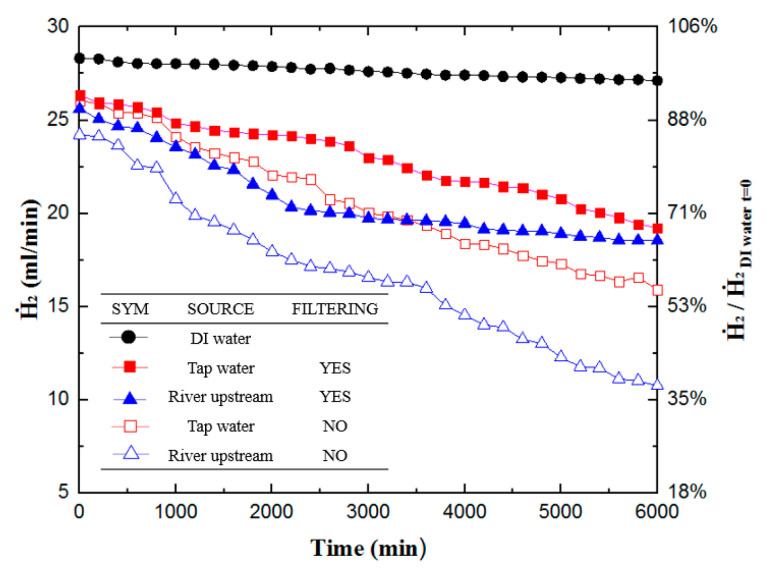
Figure 4.
Hydrogen production rates of various water sources hydrogen production experiment with different water sources. The x-axis is the time from 0 to 6000 min. The left vertical axis is the hydrogen production rate (mL/min), and the right vertical axis is the hydrogen production rate relative to the hydrogen production rate of DI water at 0 s.

