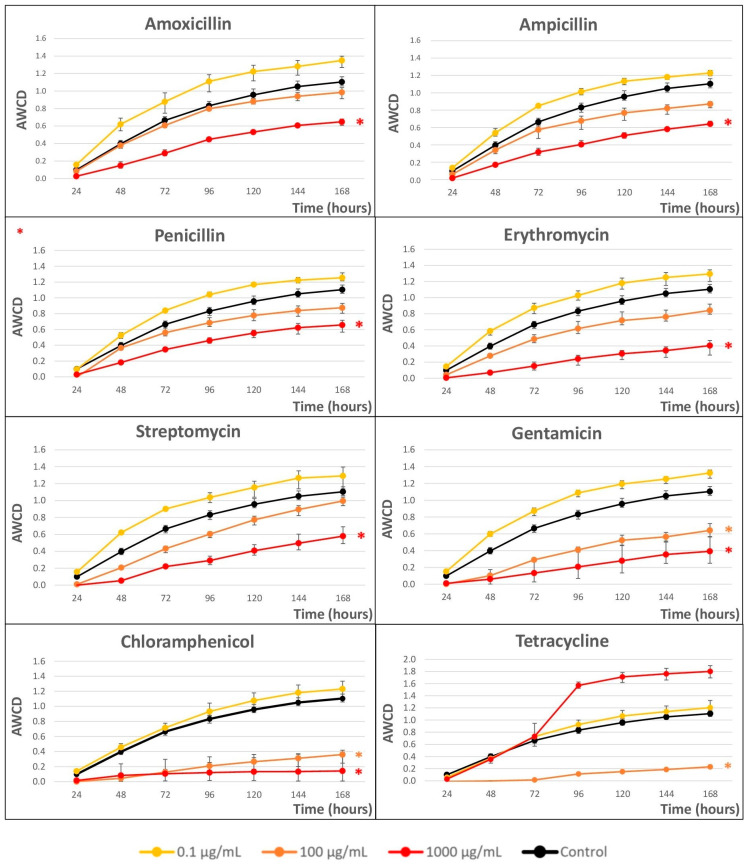
Figure 2.
Average well color development (AWCD) vs. time (h) curves at three concentrations (0.1, 100, and 1000 µg/mL) for the eight antibiotics. Statistically significant differences between antibiotic exposure and control were analyzed using the Student’s t-test. p-values < 0.05 have been marked with asterisks. Error bars represent the standard deviation of the mean of three replicates (n = 3).

